In the desired database, browse to the columns you want to analyze, select them and
click Finish to close the wizard.
In this example, you want to analyze a set of six columns in the
customer table: account number
(account_num), education
(education), email (email), first name
(fname), second name (Iname) and
gender (gender). The statistics presented in the analysis
results are the row count, distinct count, unique count and duplicate count which all
apply on records (values of a set of columns).
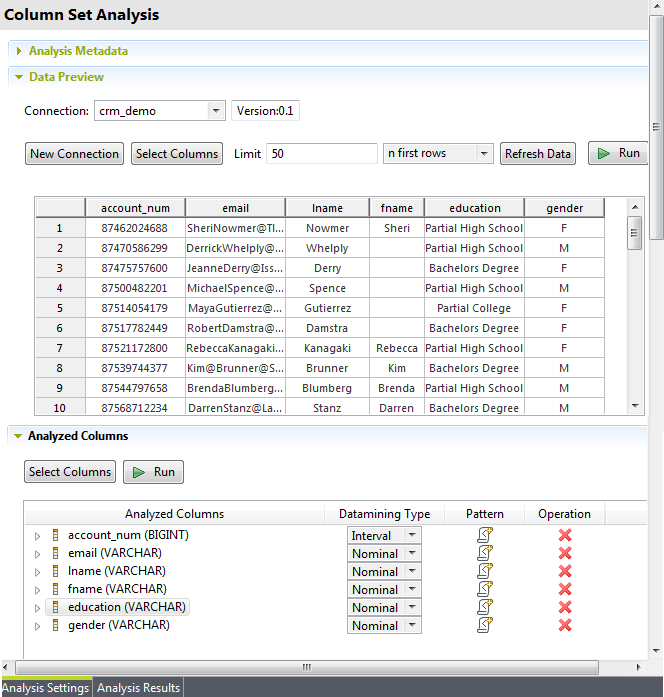
The analysis editor opens with the defined analysis
metadata, and a folder for the newly created analysis is displayed under
Analyses in the DQ Repository tree view.A sample data is displayed in the Data Preview section and the selected columns are displayed
in the Analyzed Column section of the
analysis editor.
In this example, you want to analyze a set of six columns in the customer table:
account number (account_num), education (education), email (email), first name
(fname), second name (Iname) and gender (gender). The statistics presented in the
analysis results are the row count, distinct count, unique count and duplicate
count which all apply on records (values of a set of columns).
In the Data preview section, select an option:
Option
Results
New Connection
Open a wizard and create or change the connection to the data source from
within the editor.
The Connection field on top of this
section lists all the connections created in Talend Studio.
Select Columns
Open the Column Selection dialog box where you can
select the columns to analyze or change the selection of the columns listed in
the table.
From the open dialog box, you can filter the table or column lists
by using the Table filter or Column
filter fields respectively.
n first rows or n random rows
List in the table N first data records from the selected columns or list N
random records from the selected columns.
Refresh Data
Display the data in the selected columns according to the criteria you
set.
Run with sample data
Run the analysis only on the sample dataset in the
Limit field.
In the Limit field, set the number
for the data records you want to display in the table and use as sample
data.
Did this page help you?
If you find any issues with this page or its content – a typo, a missing step, or a technical error – let us know how we can improve!