
Configuring the match analysis
Procedure
-
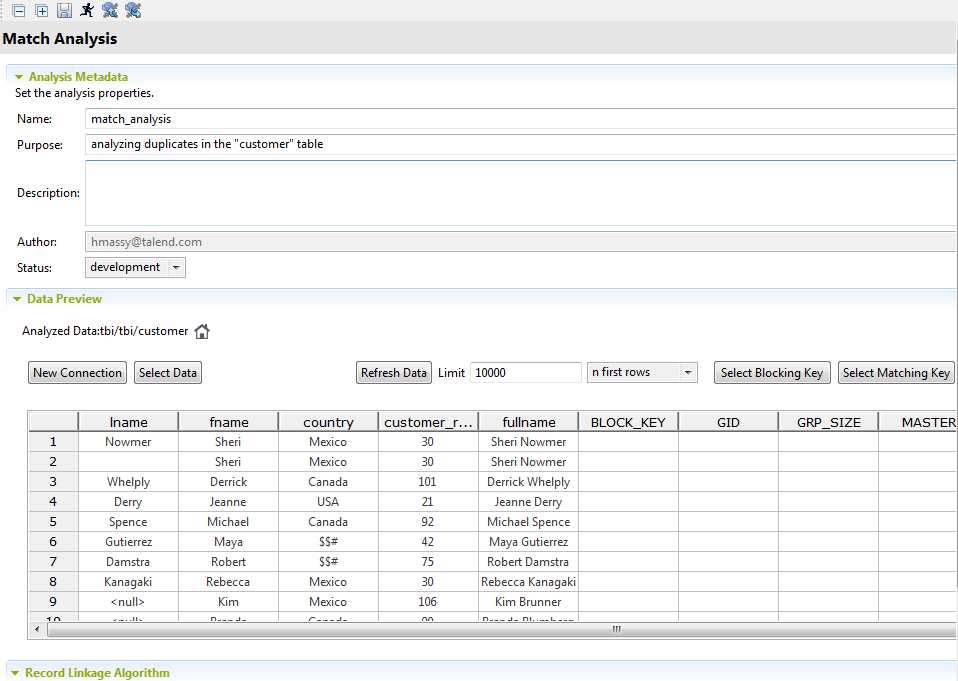
In the Limit field, set the number for the data records
you want to use as a data sample.
-
In the match analysis editor, configure the options.
Option Purpose 
Locate the selected table under the Metadata node in the tree view. New Connection Create a connection to a database or to a file from inside the match analysis editor where you can expand this new connection and select the columns on which to do the match. For further information about how to create a connection to data sources, see Creating connections to data sources.
Select Data Update the selection of the columns listed in the table. If you change the dataset for an analysis, the charts that display the match results of the sample data will be cleared automatically. You must click Chart to compute the match results for the new dataset you have defined.
Refresh Data Refresh the view of the columns listed in the table. n first rows or
n random rows
List in the table N first data records from the selected columns or list N random records from the selected columns. Select Blocking Key Define the columns from the input flow according to which you want to partition the processed data in blocks. For more information, see Defining a match rule.
Select Matching Key Define the match rules and the columns from the input flow on which you want to apply the match algorithm. For more information, see Defining a match rule.
Store on disk Store processed data blocks on the disk to maximize system performance. Max buffer size: Type in the size of physical memory you want to allocate to processed data.
Temporary data directory path: Set the path to the directory where the temporary file must be stored.
Allow drill down: Select to enable the View rows feature from the Analysis Results tab. It displays a list of duplicate rows or groups of the same size. For more information, see Viewing and exporting the analyzed data.
Results
- GID: represents the group identifier.
- GRP_SIZE: counts the number of records in the group, computed only on the master record.
- MASTER: identifies, by true or false, if
the record used in the matching comparisons is a master record. There is
only one master record per group.
Each input record will be compared to the master record, and if they match, the input record will be in the group.
- SCORE: measures the distance between the input record and the master record according to the matching algorithm used.
- GRP_QUALITY: only the master record has a quality score which is the minimal value in the group.
- ATTRIBUTE_SCORE: lists the match score and the names of the columns used as key attributes in the applied rules.
Did this page help you?
If you find any issues with this page or its content – a typo, a missing step, or a technical error – let us know how we can improve!