Setting preferences of analysis editors and analysis results
Big Data Platform
Cloud API Services Platform
Cloud Big Data Platform
Cloud Data Fabric
Cloud Data Management Platform
Data Fabric
Data Management Platform
Data Services Platform
MDM Platform
Real-Time Big Data Platform
You can decide once for all what sections to fold by default when you open any of
the connection or analysis editors. It also offers the possibility to set up the display
of all analysis results and whether to show or hide the graphical results in the
different analysis editors.
Procedure
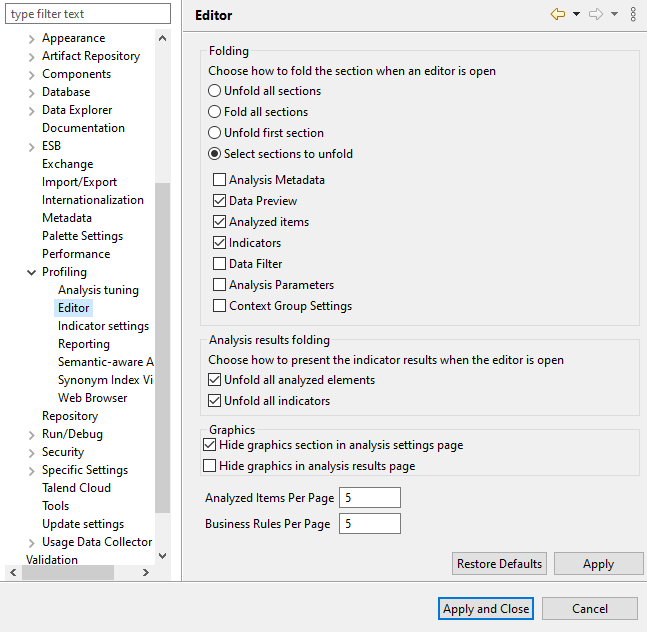
From the Profiling perspective, on the menu bar, select Window > Preferences.
Expand Talend > Profiling and select Editor.
In the Folding area, select the check boxes corresponding to
the display mode you want to set for the different sections in all the editors.
In the Analysis results folding area, select the check
boxes corresponding to the display mode you want to set for the statistic
results in the Analysis Results view of the analysis
editor.
In the Graphics area, select the Hide
graphics in analysis results page option if you do not want to
show the graphical results of the executed analyses in the analysis editor. This
will optimize system performance when you have so many graphics to
generate.
In the Analyzed Items Per Page field, set the number for
the analyzed items you want to group on each page.
In the Business Rules Per Page field, set the number for
the business rules you want to group in each page.
Information noteTip: You can always click the Restore
Defaults tab on the Preferences window to
bring back the default values.
Click Apply and then OK to
validate the changes and close the Preferences
window.
Results
While carrying on different analyses, all corresponding editors will open with the
display mode you set in the Preferences window.
Did this page help you?
If you find any issues with this page or its content – a typo, a missing step, or a technical error – let us know how we can improve!