
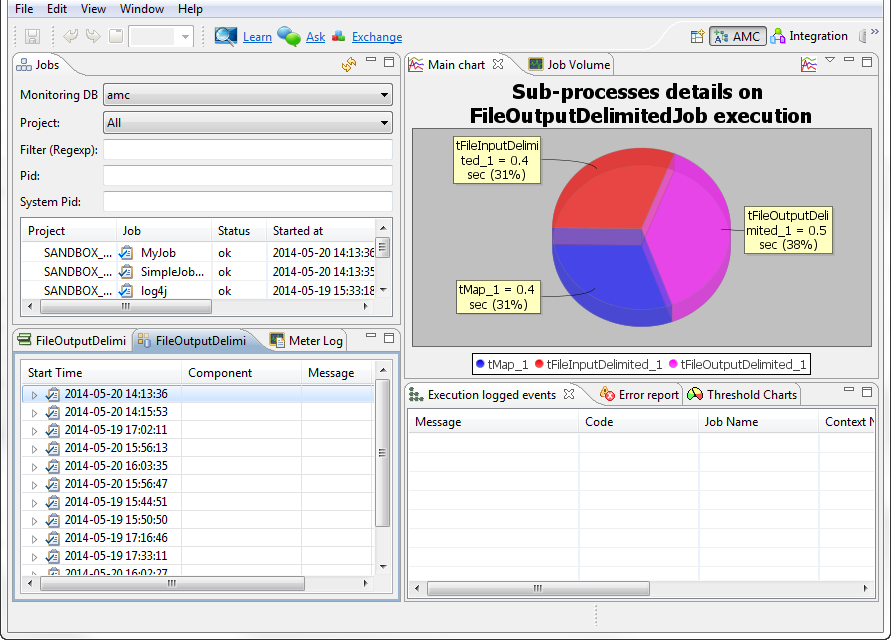
GUI of the monitoring console
The Talend Activity Monitoring Console interface consists of the following views:
-
Jobs view,
-
History and Detailed history views,
-
Meter log view,
-
Main chart view,
-
Job Volume view,
-
Logged Events view,
-
Error report view,
-
Threshold Charts view.
You can customize the views to filter the activity monitoring information and display only the information of interest in Talend Activity Monitoring Console. For more information about how to customize the views, see Customizing the monitoring console.
Did this page help you?
If you find any issues with this page or its content – a typo, a missing step, or a technical error – let us know how we can improve!