
Customizing the display of Service Activity
On the Service Activity Monitoring list, you can customize the list and select the columns you want to display.
- Click the down arrow next to any column name to display the filtering options.
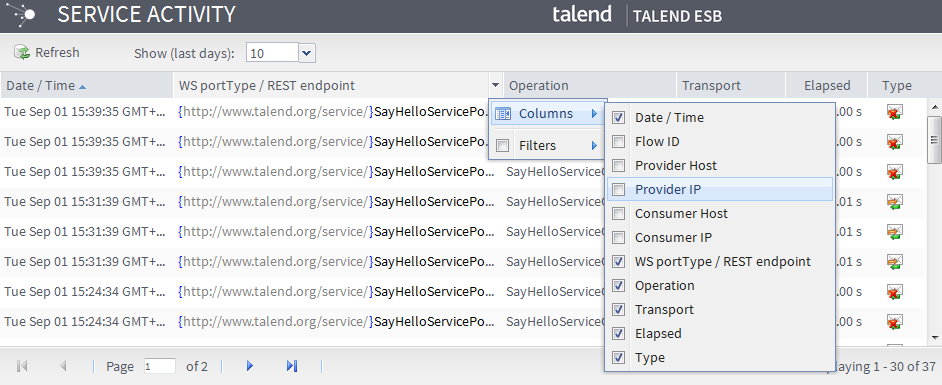
- Click Columns to display the list of available column.
- Select the check box next to the column name you want to display.
For information regarding the default information displayed, refer to Monitoring the Service endpoints from the Service Locator.
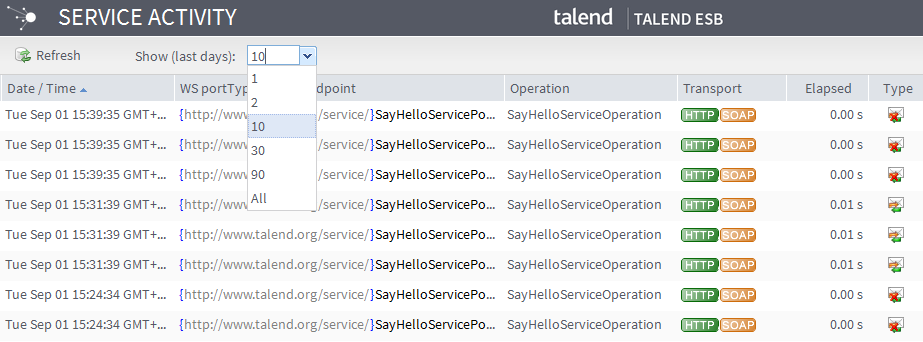
The Show (last days) filter allows you to show the events that are monitored in the specified time range.
- Click the down arrow next to the filter box.
- Select from 1, 2,
10, 30, 90,
or All. Then only the events that are monitored in the
selected number of days are displayed.
You can also choose to show the events that are monitored Before, After, or On a specific date when you select All in the Show (last days) filter:
- Click the down arrow next to the Date / Time column name to
display the filtering options.
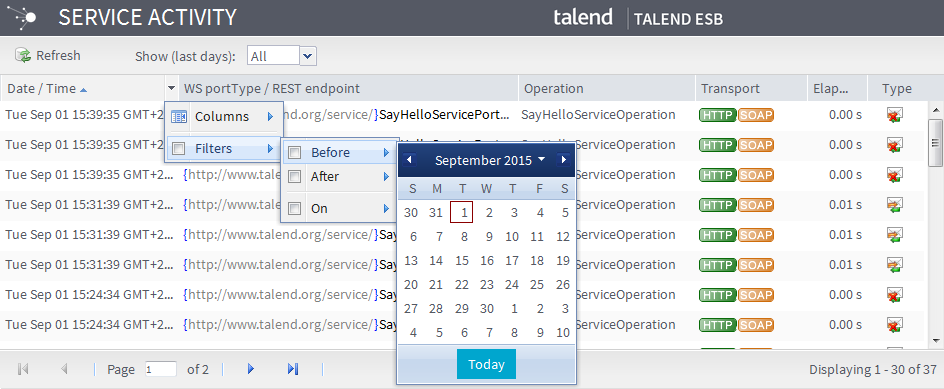
- Click Filters and select the Before, After, or On check box. Select the date in the calender.
On the Service Activity Monitoring list, you can also search the event list to find a particular message exchange:
- Click the down arrow next to any column name to display the filtering options.
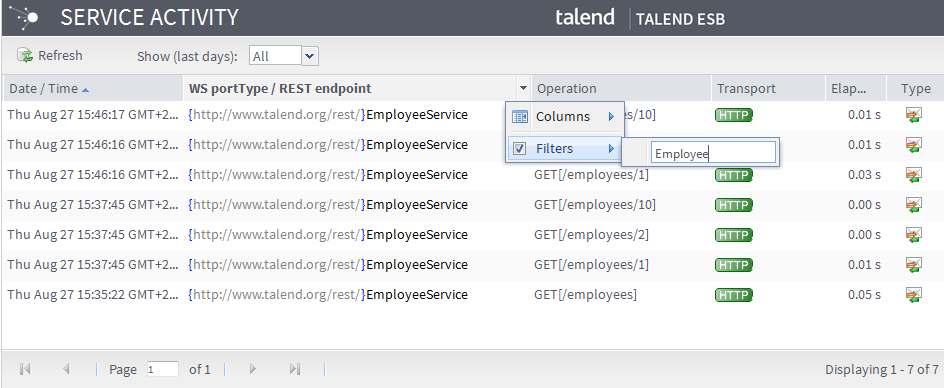
- Click Filters to access the input field,
- Type in the word to filter the list on.
On the Service Activity Monitoring list, you can also apply a filter on the Namespace field.
Did this page help you?
If you find any issues with this page or its content – a typo, a missing step, or a technical error – let us know how we can improve!