
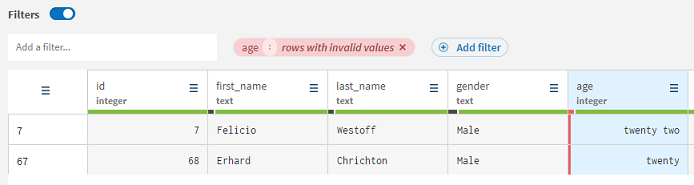
Filtering values using the quality bar
The quickest way to identify and filter incorrect data is to use the quality bar.
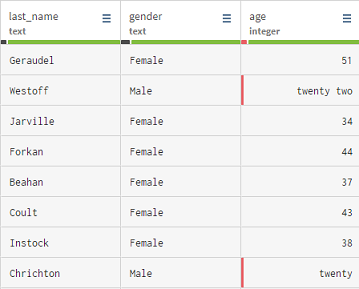
Under each column is a quality bar that displays the amount of fields that have correct data, incorrect data or empty fields. Each category is represented by a color:
- Green for data that matches the cell format
- Black for empty cells
- Red for data that does not match the cell format
From this quality bar, you can either choose to directly remove all the rows with empty or invalid data from column, or just select them and apply a filter on your data
Did this page help you?
If you find any issues with this page or its content – a typo, a missing step, or a technical error – let us know how we can improve!