
Launching basic or evolution reports
Basic and evolution reports are report documents generated on the results of the different analysis types created in the Profiling perspective of Talend Studio. These reports include column reports, overview reports, table reports or redundancy reports.
Basic reports provide the statistics collected by given analyses. Evolution reports provides information showing the evolution through time of the statistics collected by the indicators used on given analyses. Evolution reports allow you to compare current and historical statistics to determine the improvement or degradation of the analyzed data.
From the Reports menu in the web user interface, you can:
-
Use the item - subitem combination to access the data quality information and statistics generated by the reports executed in the Studio and which results are stored in the data quality datamart.
-
Launch basic or evolution reports on all analysis types directly from the web user interface.
-
Insert a header logo in any of the launched reports in order to customize these reports to comply with the corporate graphical guidelines.
The default logo file is a Talend logo, but you can decide to use a logo of your choice. For further information, see Customizing logos in reports.
The reports you generate from the Portal reuse the statistical information stored in the database and resulted from the reports generated in the Profiling perspective of Talend Studio but they are not an exact copy of these reports. While a report in the Studio can combine the results of different types of analyses in the same document, reports in the Portal are generated individually from different pages according to each analysis type and according to whether the report is a basic report or an evolution one.
-
You have accessed Talend DQ Portal as a user.
-
At least one report has been generated on an analysis in the Profiling perspective ofTalend Studio.
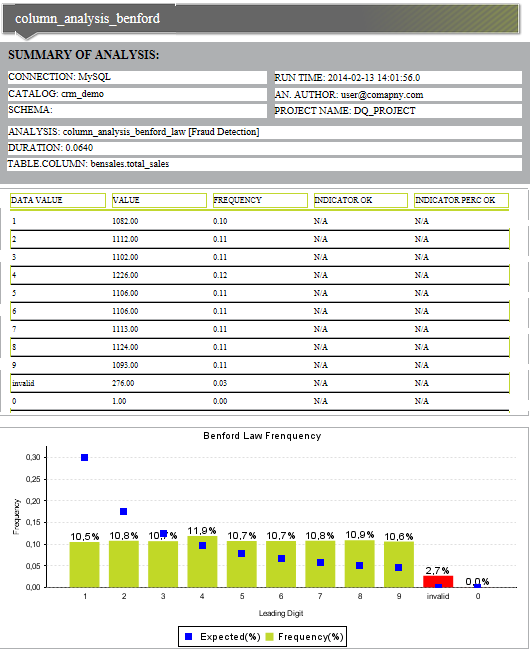
The following procedure describes an example on how to generate a report in the Portal on a column analysis that analyzes the email, fullname, and total_sales columns. Simple statistics indicators are used to analyze the first two columns; advanced statistics, pattern frequency statistics and soundex frequency statistics are used to analyze the email column and finally the Benford Law Frequency indicator is used to detect fraudulent data in the total_sales column.
To launch a standard report from Talend DQ Portal, do the following:
-
Log in to Talend DQ Portal using the user authentication information.
-
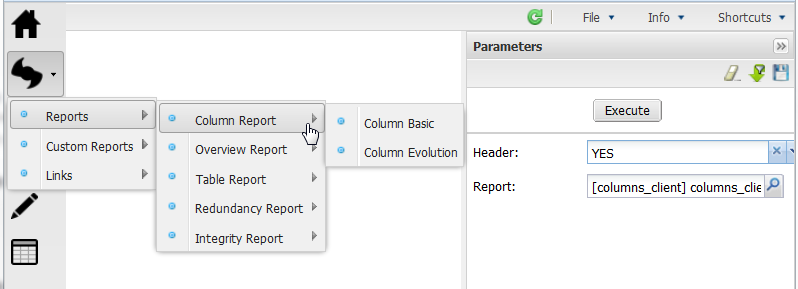
Click the
 icon, point to Reports >
Column Report and click Column Basic.
icon, point to Reports >
Column Report and click Column Basic.A page opens and a form is displayed to the right of the page.
-
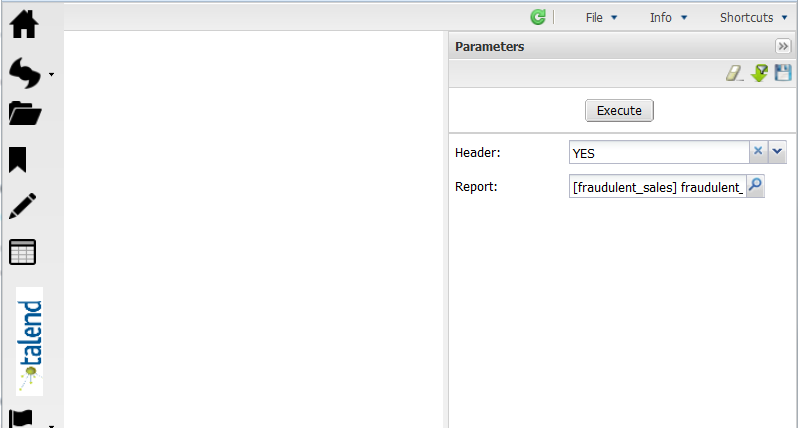
Click in the Header field and select YES if you want to insert a logo in the report to launch.
-
Click the Report explore icon.
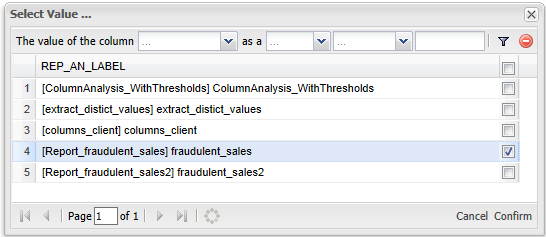
A dialog box opens to list all the reports generated on column analyses in the Profiling perspective of Talend Studio. This list shows first the name of the report followed by the name of the column analysis.
-
Select the column analysis on which you want to generate a report and then click Confirm at the bottom right corner of the dialog box.
-
Click Execute.
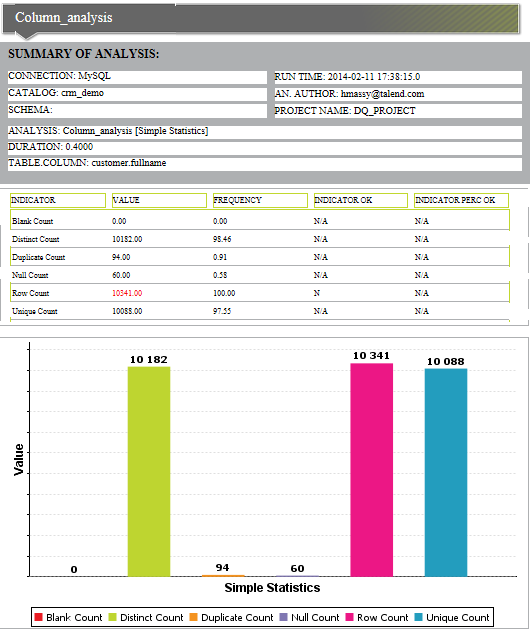
A loading indicator is displayed and then the report opens in the page. Aggregated data quality information and statistics show in the form of charts and matrices.
The simple statistics results are represented as the following for the fullname column:
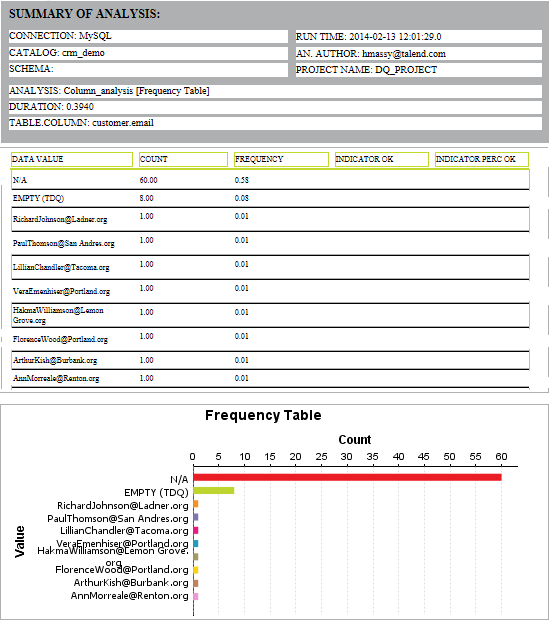
And as the following for the email column:
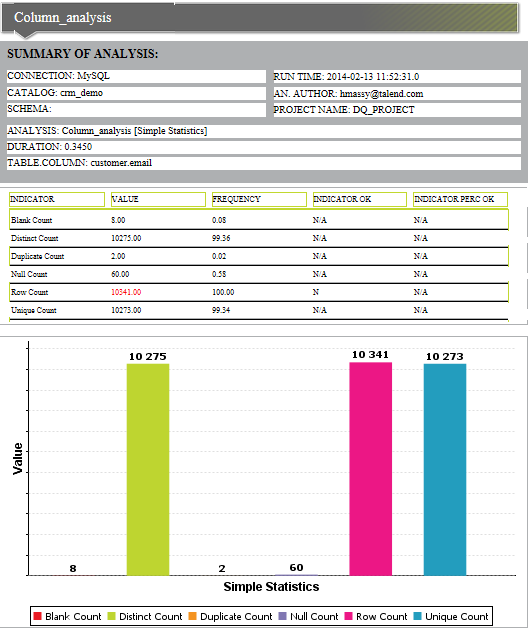
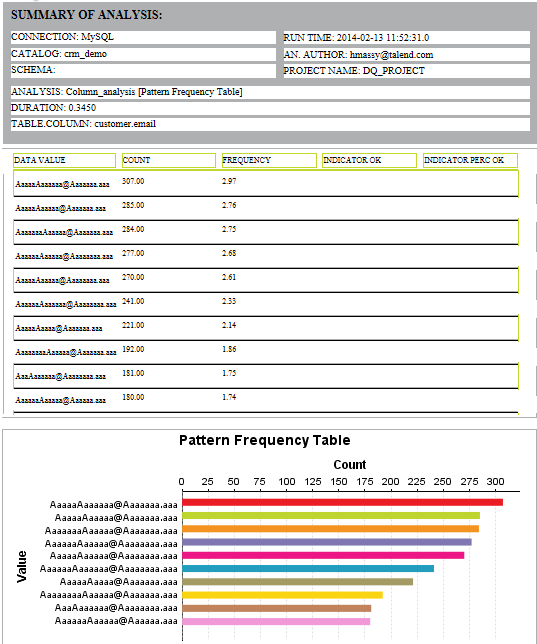
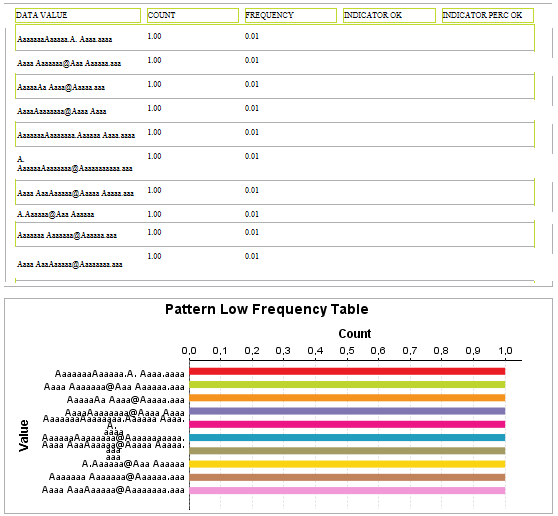
The advanced statistics results are represented as the following for the email column:
The Benford's law frequency statistics are represented as the following for the total_sales column:
The run date and time information in the basic and evolution reports is displayed in the server zone of the Portal.
-
In the top right corner of the page, click
 to save the report parameters.
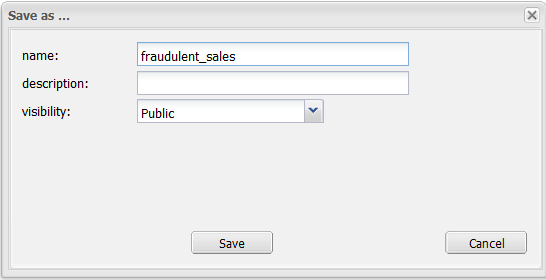
You can run a saved report without redefining its parameters, for further information, see Accessing the list of defined reports.
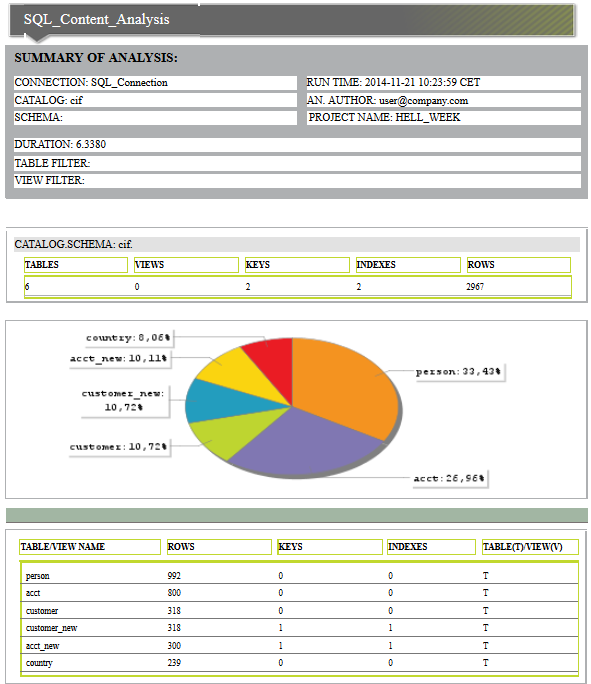
Proceed similarly to generate reports on any other analysis type including Overview analysis, Table analysis and Redundancy analysis.
For detailed information about the analysis types used to profile data, check the data profiling part in the Talend Studio User Guide.
Did this page help you?
If you find any issues with this page or its content – a typo, a missing step, or a technical error – let us know how we can improve!