
Showing analysis results
Before you begin
-
You have opened the Profiling perspective in Talend Studio.
-
You have created a column analysis. For further information, see Identifying anomalies in data.
Procedure
-
In the analysis editor, press F6 to
execute the analysis or click the Run
button.
The editor switches to the Analysis Results view. The analysis results show the generated charts for the analyzed columns accompanied with tables that detail the statistic and pattern matching results.
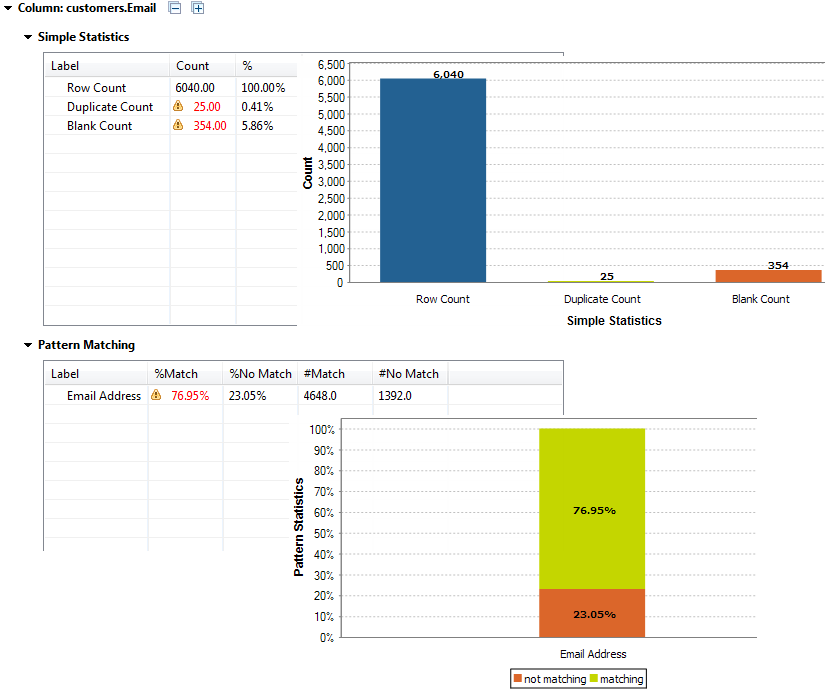
The results for the Email column look as the following:
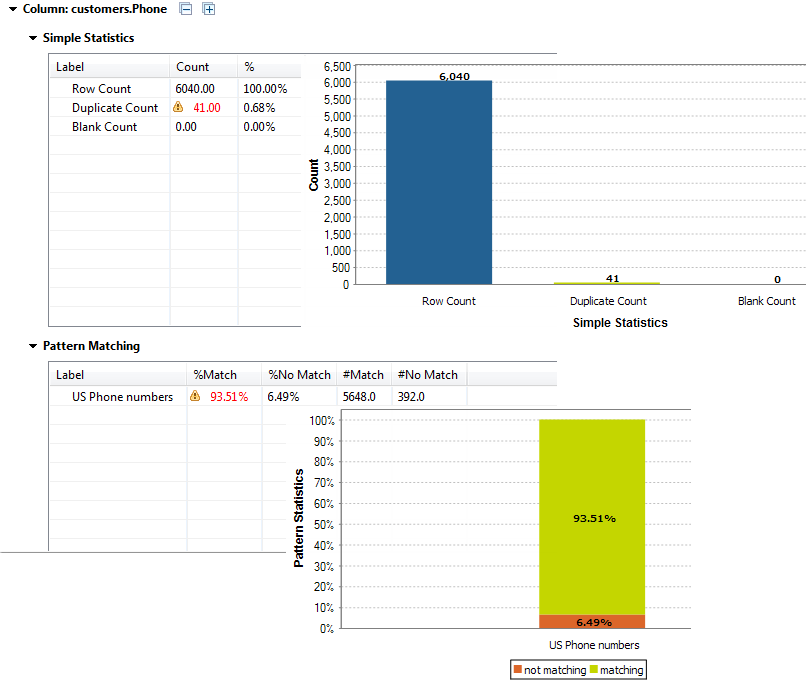
The results for the Phone column look as the following:
Results
The result sets for the Email and Phone columns give the count of the records that match and those that do not match the standard email pattern and the standard US phone numbers respectively. The results also give the blank and duplicate counts. This shows that the data is not very consistent and that it needs to be corrected.
Did this page help you?
If you find any issues with this page or its content – a typo, a missing step, or a technical error – let us know how we can improve!