
Detailed History view
The Detailed History view is also based on the Start Time and PID of each Job execution. Similarly, the latest execution instance is shown at the top of the list.
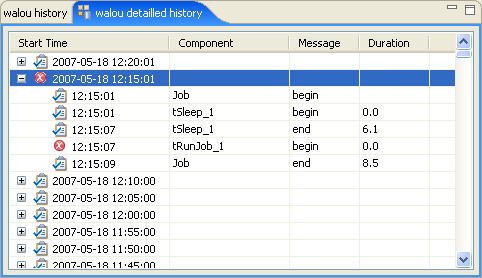
Click on the relevant entry to expand the node and display the details.
The details include the name of each component involved in the instance selected and the corresponding message (begin or end). These components appear in a logical sequence based on the order, and each component is run in the Job.
For all components, the execution message is displayed. If one message (most likely the end message) is missing, this often corresponds to an execution error, that should be illustrated with the red icon.
Also the component execution duration is displayed (Duration).
The Main Chart view displays a pie chart representing for each component, its respective share of the execution time.
For more information, see Main Chart view.
Did this page help you?
If you find any issues with this page or its content – a typo, a missing step, or a technical error – let us know how we can improve!