Skip to main content Skip to complementary content
Close announcements banner

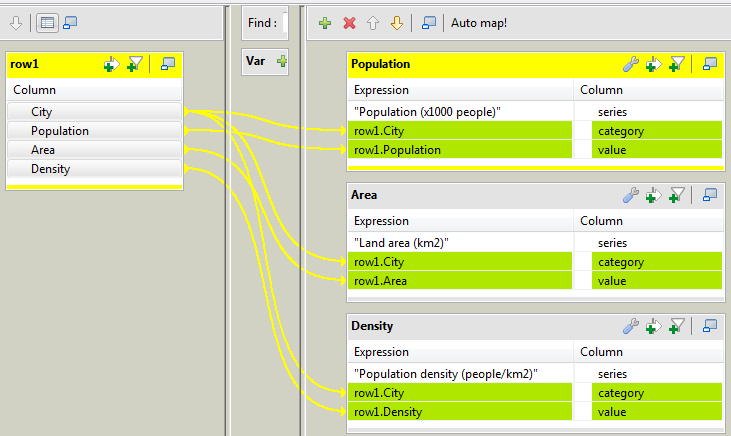
Adapting the source data to the tBarChart schema

Procedure

  1. Double-click the tMap to open the Map Editor.
    You can see an input table on the input panel, row1 in this example, and three empty output tables, named Population, Area, and Density on the output panel.
  2. Use the Schema editor to add three columns to each output table: series (string), category (string), and value (integer).
  3. In the relevant Expression field of the output tables, enter the text to be presented in the legend area of the bar chart, "Population (x1000 people)", "Land area (km2)", and "Population density (people/km2)" respectively in this example.
  4. Drop the City column of the input table onto the category column of each output table.
  5. Drop the Population column of the input table onto the value column of the Population table.
  6. Drop the Area column of the input table onto the value column of the Area table.
  7. Drop the Density column of the input table onto the value column of the Density table.
  8. Click OK to save the mappings and close the Map Editor and propagate the output schemas to the output components.

Did this page help you?

If you find any issues with this page or its content – a typo, a missing step, or a technical error – let us know how we can improve!