
Executing the Job
Procedure
-
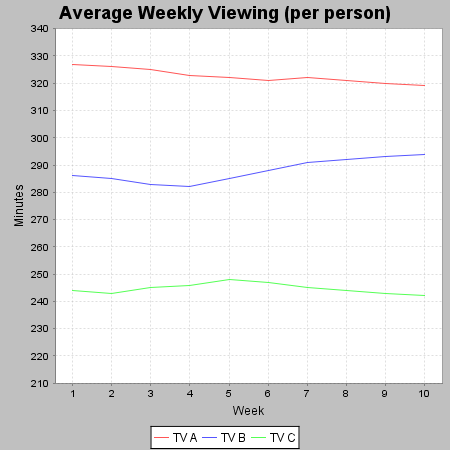
Press F6 to launch the Job.
A line chart is generated as defined, showing a graphical comparison of the average weekly viewing time and the viewing trends of different TV channels over the past ten weeks.
Did this page help you?
If you find any issues with this page or its content – a typo, a missing step, or a technical error – let us know how we can improve!