
Selecting the address columns and setting sample data
Procedure
-
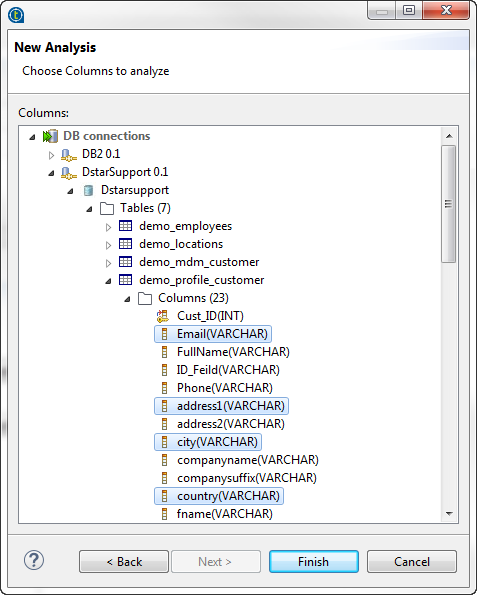
Expand DB connections and browse to the
address columns you want to analyze.
-
Select the columns and click Finish to
close the wizard.
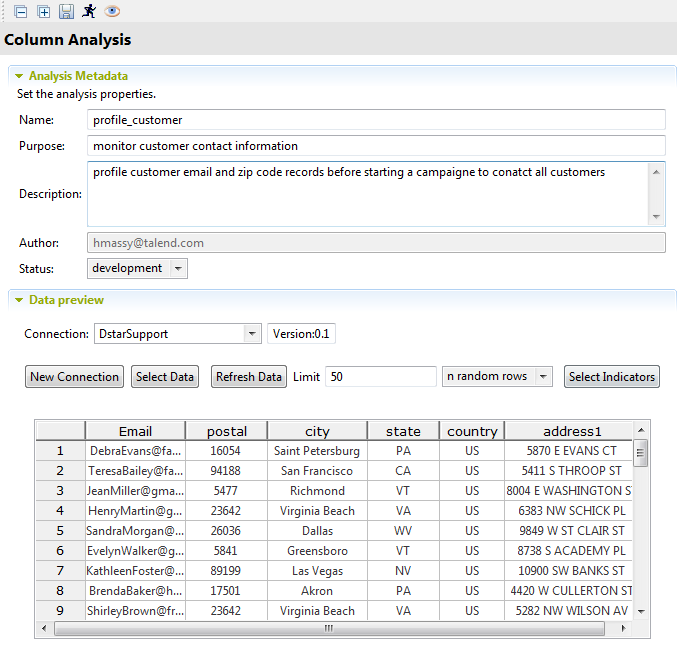
A file for the newly created column analysis is listed under the Analysis node in the DQ Repository tree view, and the analysis editor opens with the analysis metadata.
Did this page help you?
If you find any issues with this page or its content – a typo, a missing step, or a technical error – let us know how we can improve!