
Setting system indicators
Procedure
-
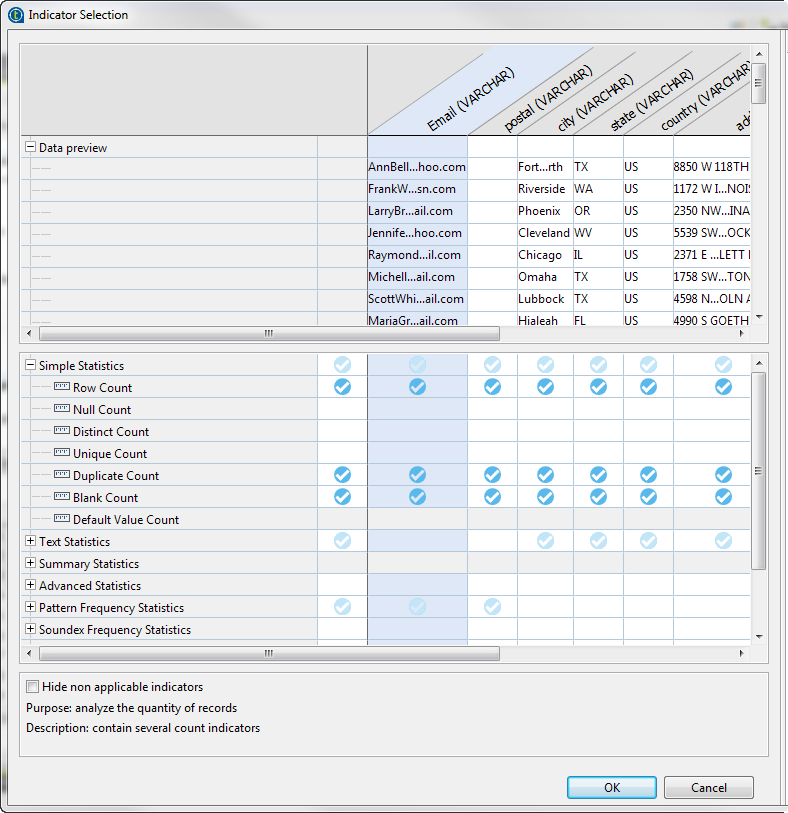
From the Data Preview section in the analysis editor, click Select indicators to open the
Indicator Selection dialog
box.
-
Click in the cells next to indicators names to set
indicator parameters for the analyzed columns and click
OK.
You want to see the row, blank and duplicate counts in all columns to see how consistent the data is. Also you want to use the Pattern Frequency Table indicator on the email and postal columns in order to compute the number of most frequent records for each distinct pattern or value.
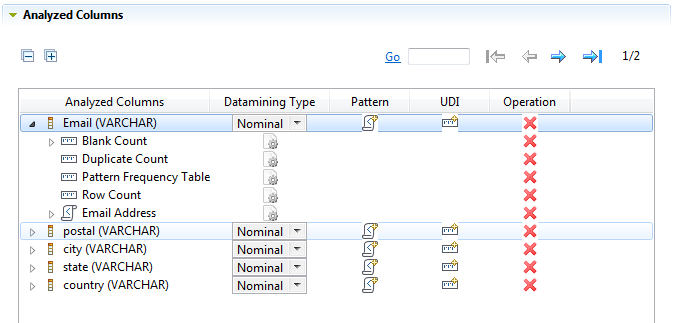
Indicators are added accordingly to the columns in the Analyzed Columns section.
-
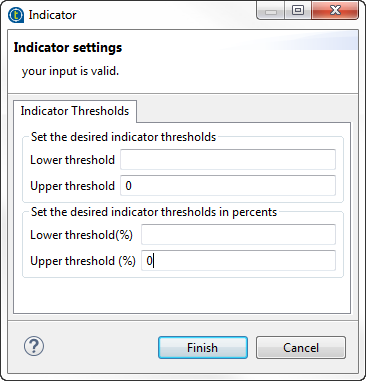
Click the
 icon next to the Blank Count indicator and set
0 in the Upper threshold field.
icon next to the Blank Count indicator and set
0 in the Upper threshold field.
Defining thresholds on indicators is very helpful as it will write in red the count of the null values in the analysis results.
Did this page help you?
If you find any issues with this page or its content – a typo, a missing step, or a technical error – let us know how we can improve!