
Filtering tasks using charts
You can use the Chart tab in the profiling area to filter data and list only the task you want to resolve or you want to assign or delegate to specific data stewards.
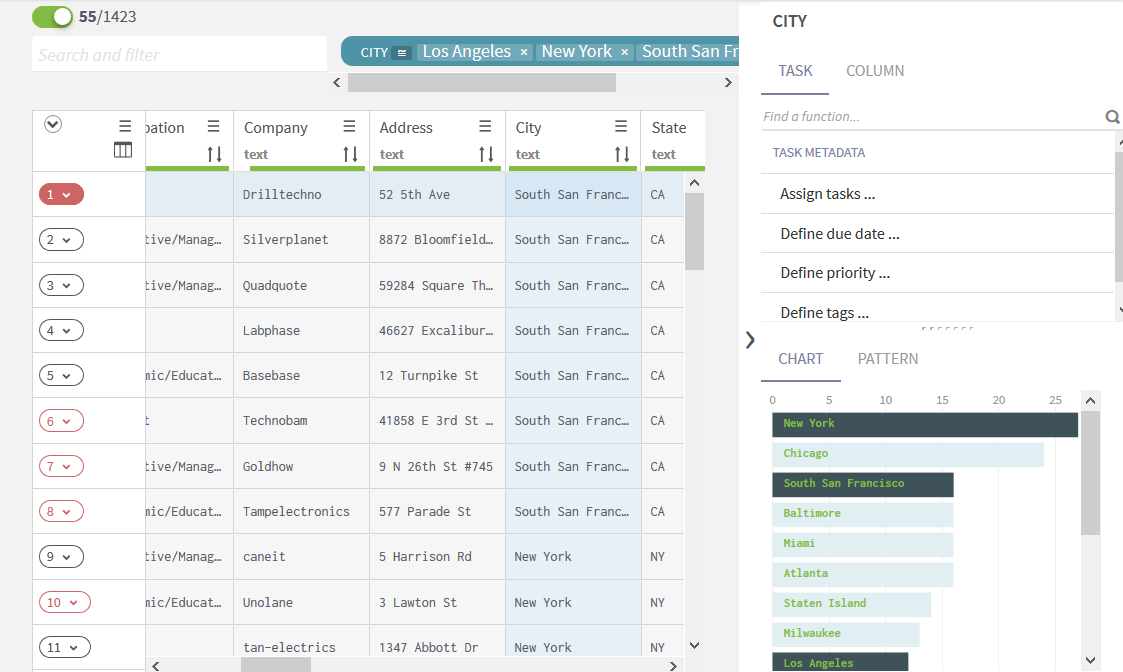
Charts are graphical representations of the distribution of the values contained in the selected column. Charts are displayed next to the task list and they differ according to the type of the data you select.
Procedure
-
Click the bar which values you want to filter, or hold the
Shift
key and select multiple bars
in the chart to list the corresponding tasks.
The filter detail is added on top of the list and a switch is displayed on the top left corner.
Did this page help you?
If you find any issues with this page or its content – a typo, a missing step, or a technical error – let us know how we can improve!