
The Traces Debug mode
In the Traces Debug mode, Talend Studio provides the capability to monitor the data row-by-row as it flows between different components in a subJob. You can choose to activate or deactivate Traces or decide what processed columns to display in the traces table that displays on the design workspace when launching the current Job. You can either choose to monitor the whole data processing or monitor the data processing row-by-row or at a certain breakpoint.
- With your Job open in Talend Studio, open the Run view and then select Debug Run.
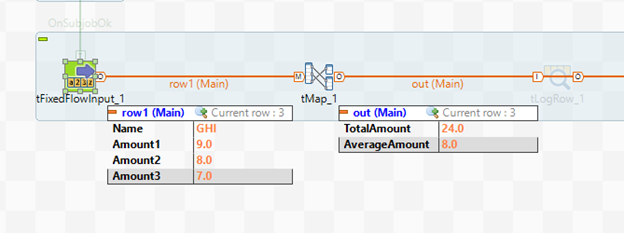
- Click the Traces Debug
button. The Job runs, with row content displayed under each main > row
link.
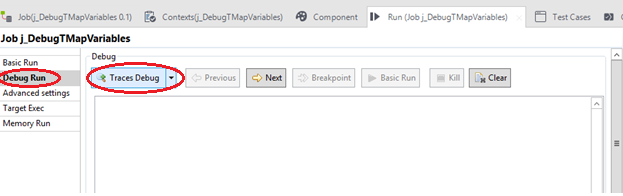 Information noteNote: Click the triangle in the right part of the button and select Traces Debug if Traces Debug does not appear on the button.
This is an excellent way of debugging Jobs when you are working with a small sample of data. However, debugging Jobs that handle large volumes of data in this mode is not recommended because displaying every row visually in the Studio console can slow down the execution of the Job. In this case, you can try the Java Debug mode.
Did this page help you?
If you find any issues with this page or its content – a typo, a missing step, or a technical error – let us know how we can improve!