Skip to main content Skip to complementary content
Close announcements banner

Opening the Kibana dashboard

You can open the Kibana dashboard to visualize the content of the ontology repository.

Procedure

  1. In the Talend Administration Center Menu tree view, click Logging to display the Kibana dashboard, or open a Web browser and go to http://localhost:8080/kibana/#/dashboard/.
  2. From the left menu bar, click Management > Kibana > Saved Objects.
  3. Click Import and browse to the file you retrieved from the Downloads tab in the left panel of this page (semantic_repository_content-20201211.ndjson).

    The semantic_repository_content-20201211.ndjson file is provided as an example of dashboard that displays visualizations related to the ontology repository.

    You can define your own dashboards and visualizations.

  4. From the left menu bar, click Dashboard.
  5. Select Semantic Repository Dashboard from the list.

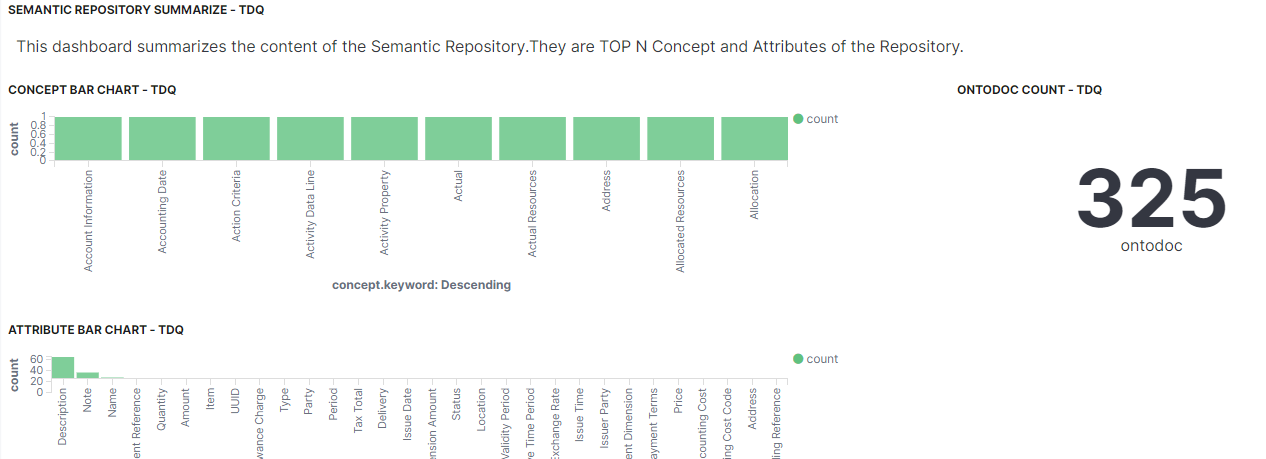
    The dashboard displays the most frequent concepts and the attributes stored in the ontology repository.

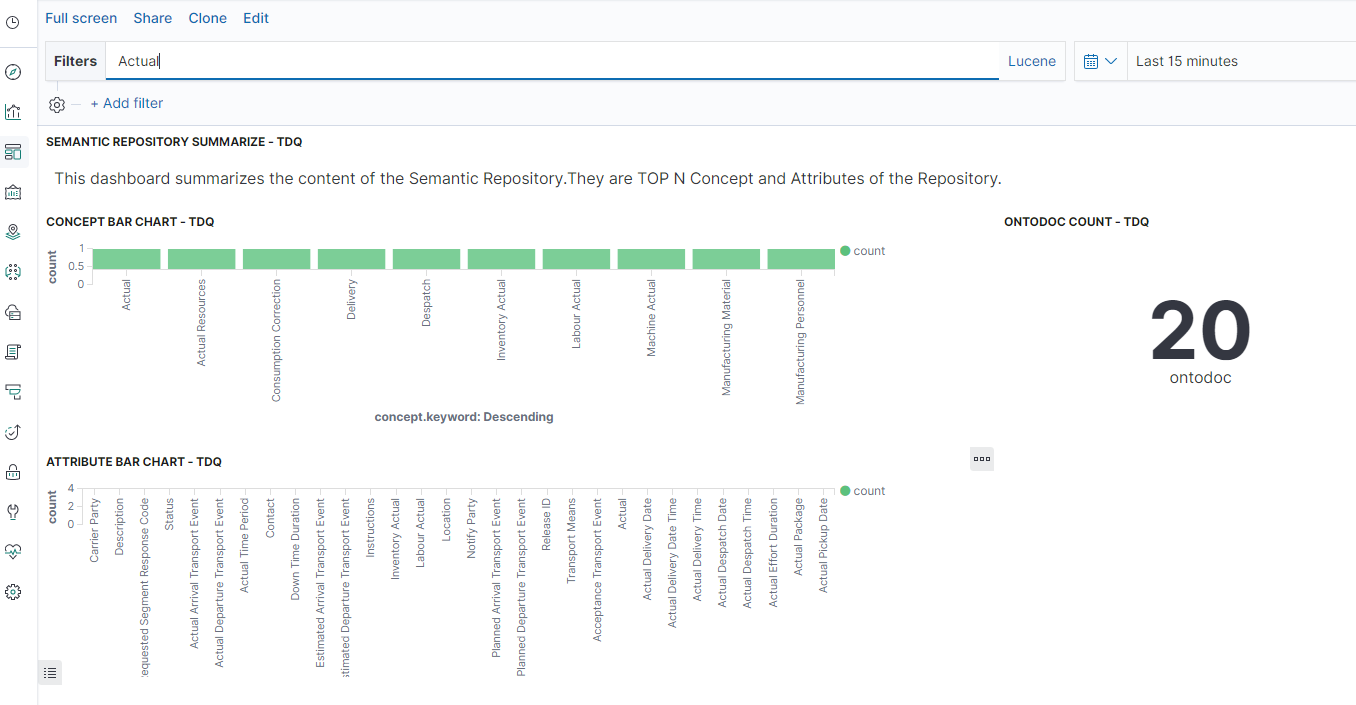
  6. Use the search field on top of the dashboard to search for a concept, an attribute, and filter the results listed in the dashboard.

Did this page help you?

If you find any issues with this page or its content – a typo, a missing step, or a technical error – let us know how we can improve!