
Browsing the graphical view of a data model
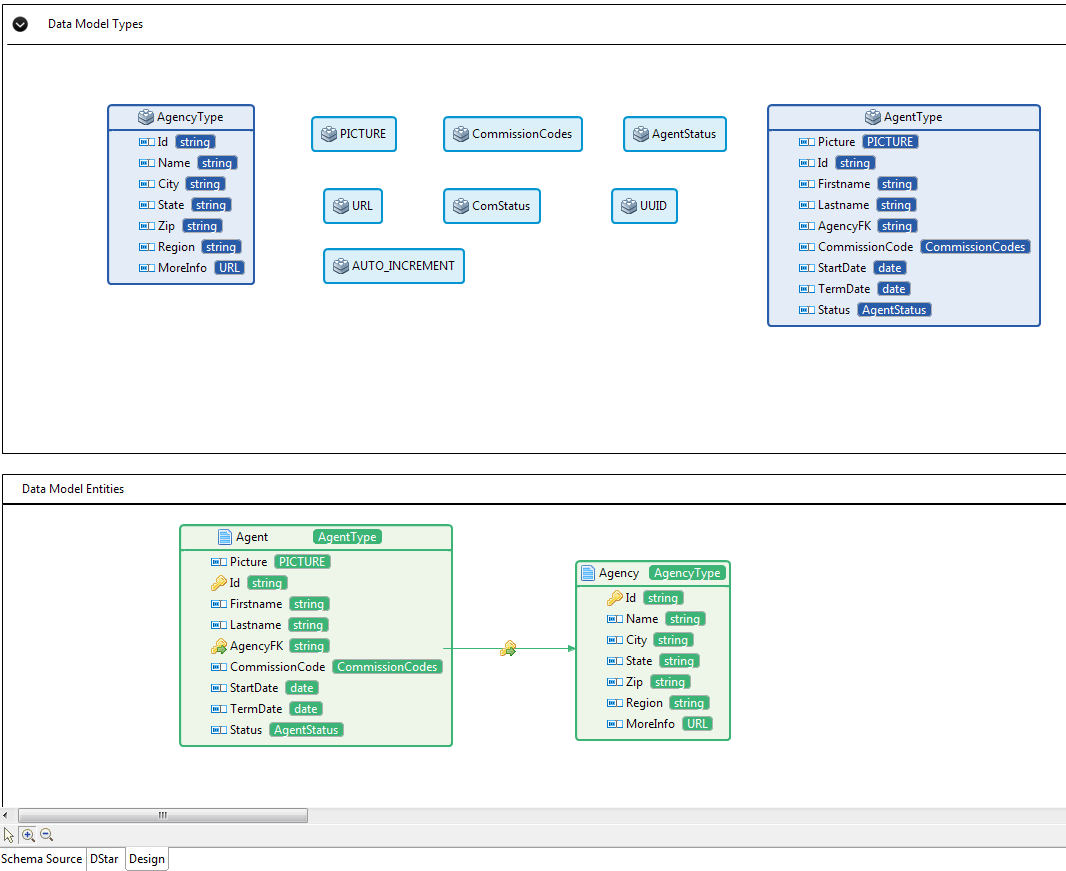
In the data model editor, you can click the Design tab to switch to the graphical view of the data model.
The view presents the data model in a graphical format, which shows the custom types and complex types in the upper area and the data model entities in the lower area.
You can make the graphical view zoom in or zoom out by clicking the  and
the
and
the  buttons at the bottom of the view.
In the Data Model Types area, each complex type is represented by a rectangle.
In the Data Model Entities area, each entity is represented by
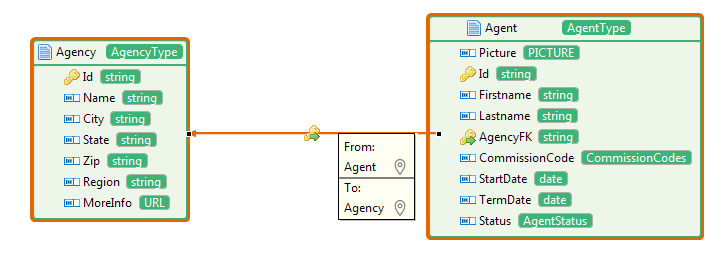
a rectangle, with its attributes and attribute types. The relationships between
entities are represented by links between them, which have a key icon with a green
arrow ![]() .
.
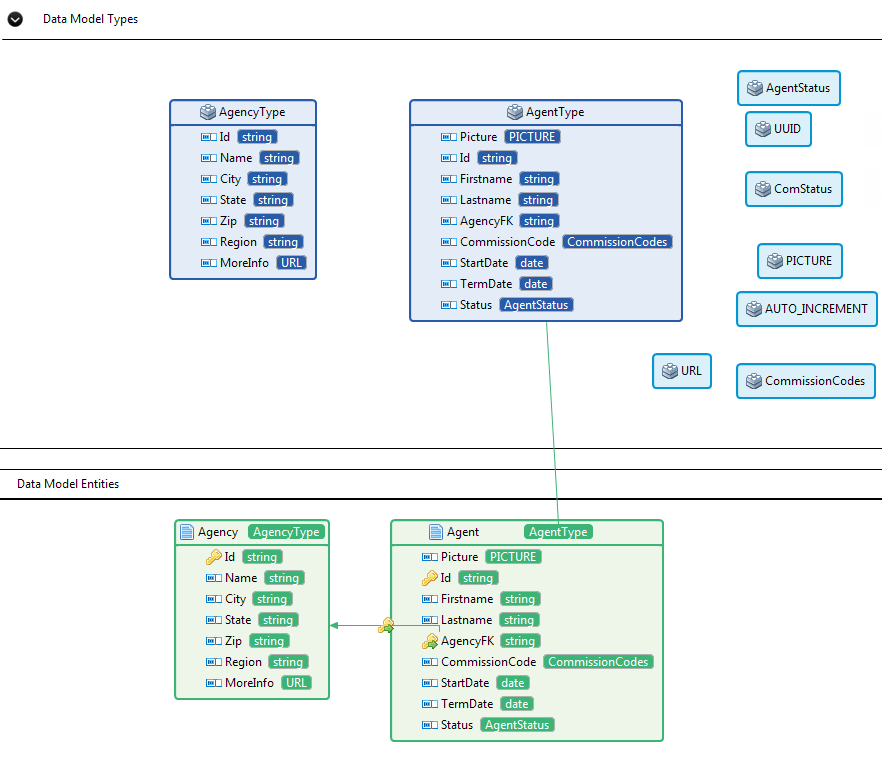
In the Data Model Entities area, each time you click a complex type, a link will be displayed pointing to the representation of the complex type in the Data Model Types area, which helps you to learn the definition of the complex type.
You can customize the layout of the graphical view. See Customizing the layout of the graphical view for details.
The graphical view of a data model can be saved as an image file. See Saving the graphical view of a data model as an image file for details.
You can also check the outline view of a data model. See Checking the outline view of a data model for details.
Did this page help you?
If you find any issues with this page or its content – a typo, a missing step, or a technical error – let us know how we can improve!