Generating an analysis on the join results to analyze duplicates - Cloud - 7.3

Talend Studio User Guide

Version
Cloud
7.3
Language
English
Product
Talend Big Data
Talend Big Data Platform
Talend Cloud
Talend Data Fabric
Talend Data Integration
Talend Data Management Platform
Talend Data Services Platform
Talend ESB
Talend MDM Platform
Talend Real-Time Big Data Platform
Module
Talend Studio
Content
Design and Development
Last publication date
2024-02-13
Available in...

Big Data Platform

Cloud API Services Platform

Cloud Big Data Platform

Cloud Data Fabric

Cloud Data Management Platform

Data Fabric

Data Management Platform

Data Services Platform

MDM Platform

Real-Time Big Data Platform

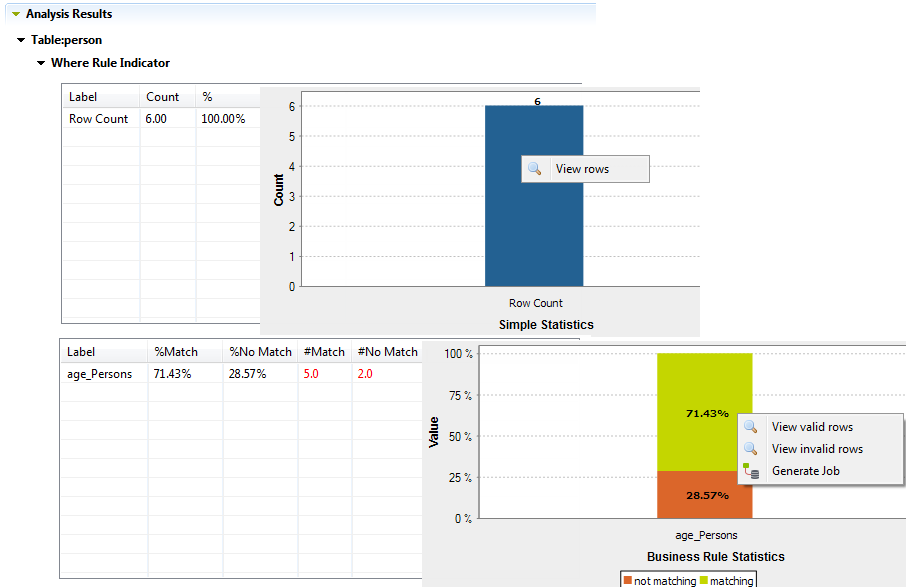
In some cases, when you analyze database tables that have some duplicate records and a join clause, using an SQL business rule, the join results show that there are more rows in the joint than in the analyzed table.

You can generate a ready-to-use analysis to analyze these duplicate records. The results of this analysis help you to better understand why there are more records in the join results than in the table.

Before you begin

A table analysis with an SQL business rule, that has a join condition, is defined and executed in the Profiling perspective of Talend Studio. The join results must show that there are duplicates in the table.

For more information, see Creating a table analysis with an SQL business rule with a join condition.

Procedure

  1. After creating and executing an analysis on a table that has duplicate records as outlined in Creating a table analysis with an SQL business rule with a join condition, click the Analysis Results tab at the bottom of the analysis editor.
  2. Right-click the join results in the second table and select Analyze duplicates.

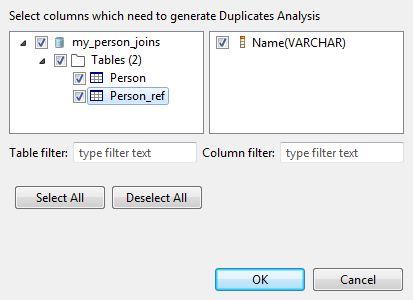
    The Column Selection dialog box opens with the analyzed tables selected by default.

  3. Modify the selection in the dialog box if needed and then click OK.
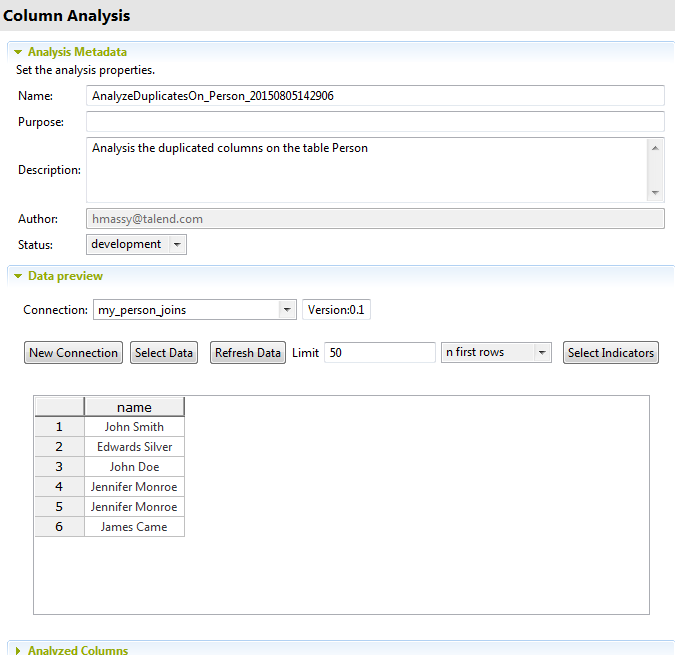
    Two column analyses are generated and listed under the Analyses folder in the DQ Repository tree view and are open in the analysis editor.
  4. Save the analysis and press F6 to execute it.
    The analysis results show two bars, one representing the row count of the data records in the analyzed column and the other representing the duplicate count.
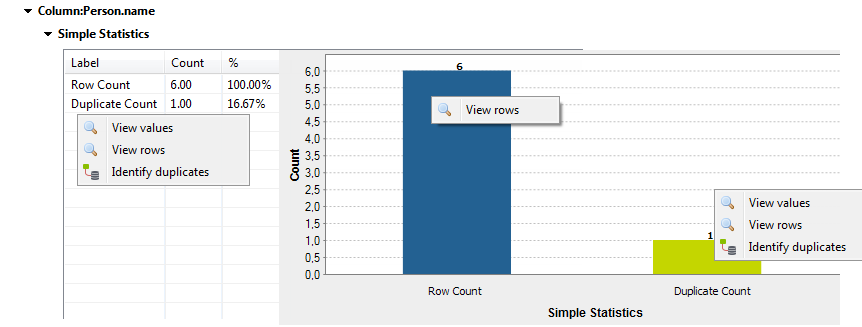
  5. Click Analysis Results at the bottom of the analysis editor to access the detail result view.
  6. Right-click the row count or duplicate count results in the table, or right-click the result bar in the chart itself and select:
    Option To...

    View rows

    open a view on a list of all data rows or duplicate rows in the analyzed column.
    View values open a view on a list of the duplicate data values of the analyzed column.
    Identify duplicates generate a ready-to-use Job that identifies and separates unique and duplicate records in the selected column for subsequent processing. This Job outputs all the duplicates in a reject CSV file by default, and writes the unique values in another separate file.