
Selecting the columns you want to analyze and setting analysis parameters
Procedure
-
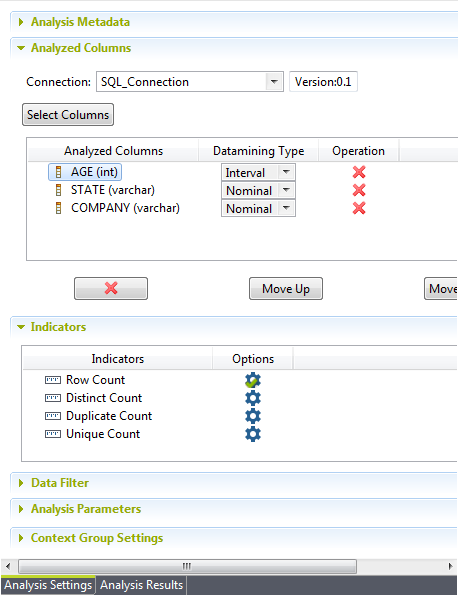
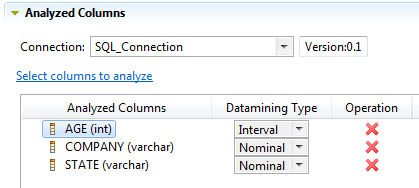
In the analysis editor and from the Connection list, select the database connection on which to run
the analysis.
 The numerical correlation analysis is possible only on database columns for the time being. You can change your database connection by selecting another connection from the Connection list. If the analyzed columns do not exist in the new database connection you want to set, you receive a warning message that enables you to continue or cancel the operation.
 -
In the column list, select the check boxes of the column(s) you want to
analyze and click OK.
In this example, you want to compute the age average of the personnel of different enterprises located in different states. Then the columns to be analyzed are AGE, COMPANY and STATE.You can drag the columns to be analyzed directly from the corresponding database connection in the DQ Repository tree view into the Analyzed Columns area.If you right-click any of the listed columns in the Analyzed Columns view and select Show in DQ Repository view, the selected column will be automatically located under the corresponding connection in the tree view.The selected columns are displayed in the Analyzed Column view of the analysis editor.
-
In the Indicators view, click
 to open a dialog box where you can set thresholds for each
indicator.
to open a dialog box where you can set thresholds for each
indicator.
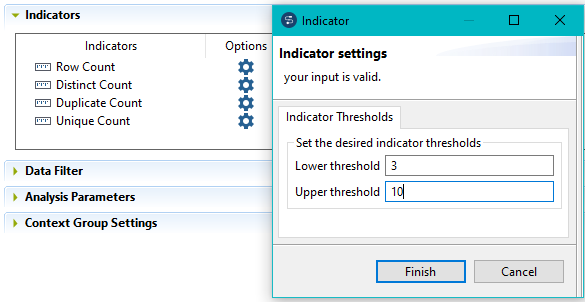 The indicators representing the simple statistics are by-default attached to this type of analysis.
Results
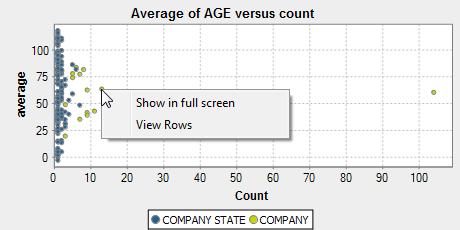
For more information about the analysis results, see Exploring the results of the numerical correlation analysis.
Did this page help you?
If you find any issues with this page or its content – a typo, a missing step, or a technical error – let us know how we can improve!