
Pie chart (components)
In the Detailed History view, select an instance of the Job execution. The Main Chart view displays the time share taken by each component in the overall Job execution time.
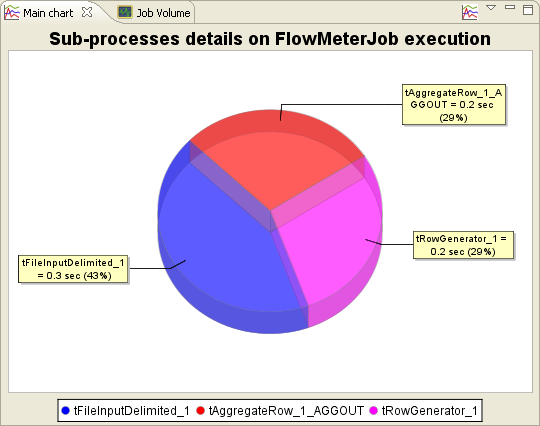
The pie chart is thus divided among all components composing the Job and having the tStatCatcher statistics option checked (on in their respective Component view of Talend Studio).
Each component shows in a different color, defined in a caption at the bottom of the chart. A detailed information about each share is provided next to the pie chart.
If the Job instance is a parent Job, the pie chart shows the execution time share between each children Job if you selected the tStatCatcher Statistics check box on each of tRunJob component calling in a new child Job.
Did this page help you?
If you find any issues with this page or its content – a typo, a missing step, or a technical error – let us know how we can improve!