
Filtering on these values to create an "or" condition
Now that you have a way of knowing which rows match the regular expression, you will be able to retrieve them all by creating a filter on this new column.
Procedure
-
Click the header of the car_year_matching column to select its content.
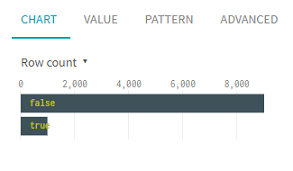
In the data profiling area, on the bottom right of the screen, you can see a horizontal bar chart showing the repartition between the true and false values in the column. Point your mouse over each bar to display the exact number of occurrences.
-
To create the filter, click the true bar.
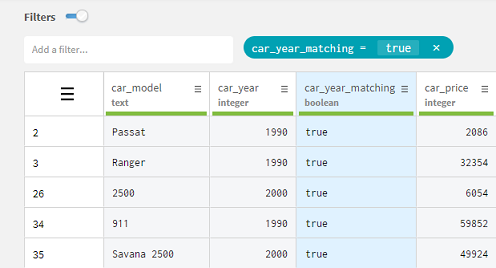
You can see from the filter bar that the filter was applied on the dataset, and customers data is only displayed if it matches the condition previously set by the regular expression.
Results
Did this page help you?
If you find any issues with this page or its content – a typo, a missing step, or a technical error – let us know how we can improve!