
Executing the analysis and displaying the profiling results
Procedure
Results
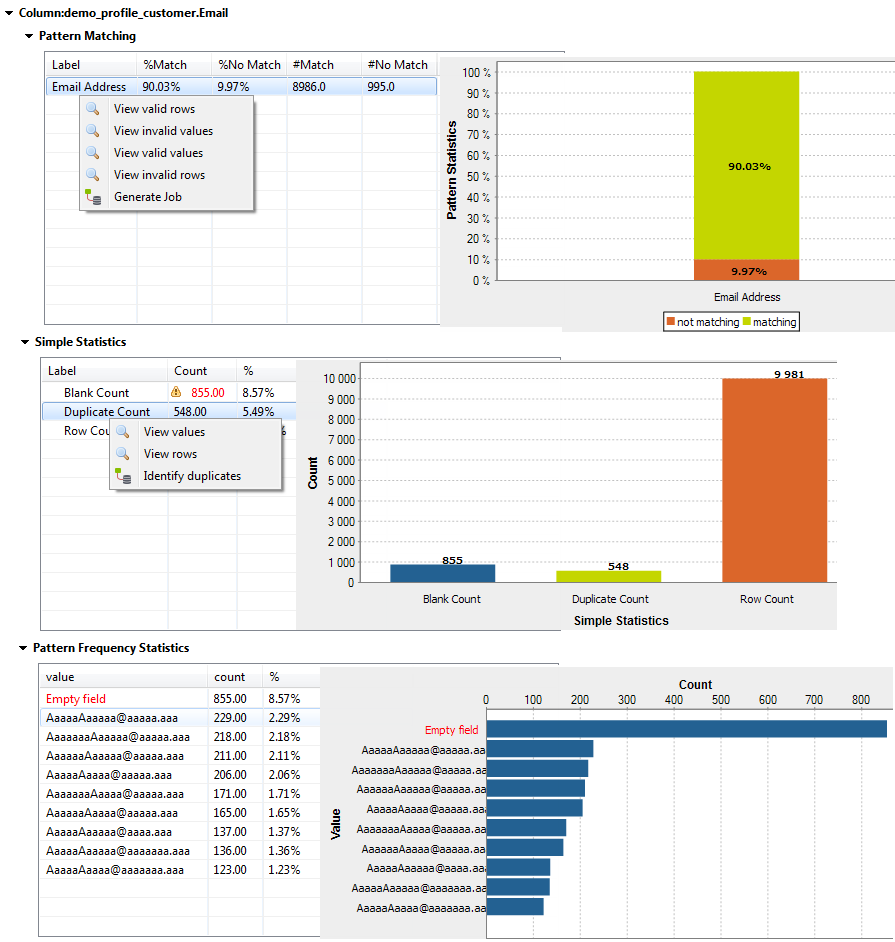
The pattern matching results show that about 10% of the email records do not match the standard email pattern. The simple statistic results show that about 8% of the email records are blank and that about 5% are duplicates. And the pattern frequency results give the number of most frequent records for each distinct pattern. This shows that the data is not consistent and you need to correct and cleans the email data before starting your campaign.
The results for the postal column look as the following:
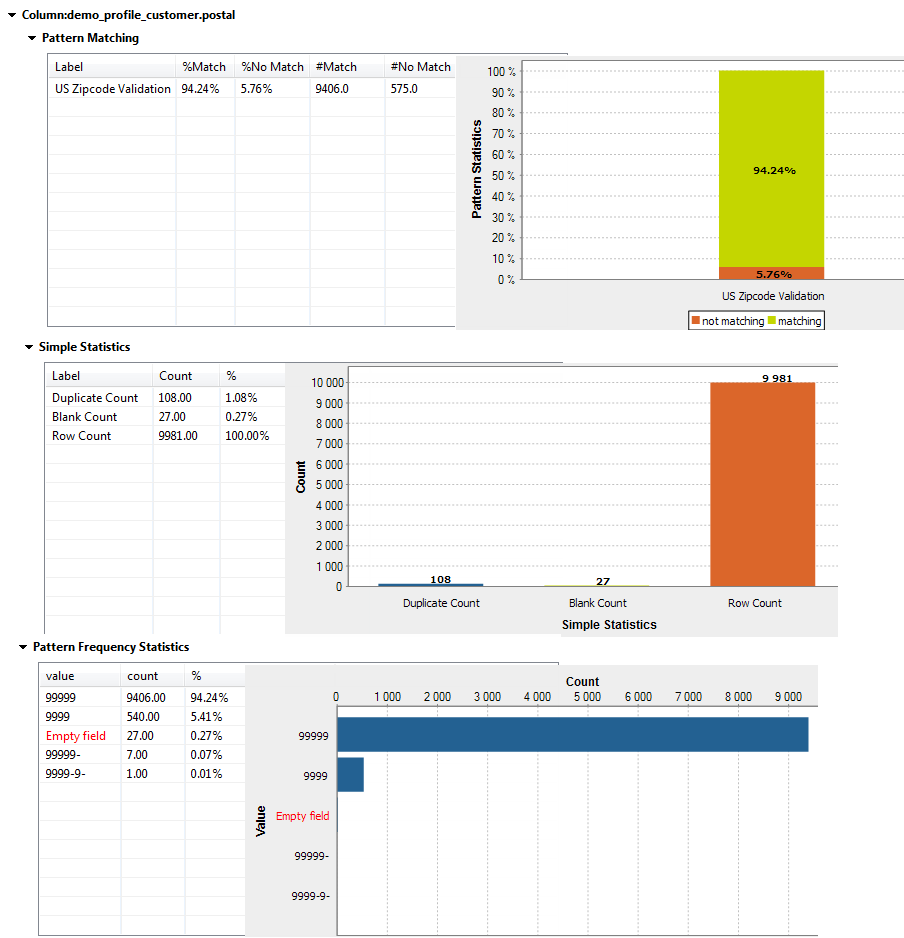
The result sets for the postal column give the count of the records that match and those that do not match a standard US ZIP code format. The results sets also give the blank and duplicate counts and the number of most frequent records for each distinct pattern. These results show that the data is not very consistent.
Then some percentage of the customers can not be contacted by either email or US mail service. These results show clearly that your data is not very consistent and that it needs to be corrected.
Did this page help you?
If you find any issues with this page or its content – a typo, a missing step, or a technical error – let us know how we can improve!