
Talend ESB architecture
Each of the operating principles can be isolated in different functional blocks. The following diagram describes the different types of blocks and their interoperability:
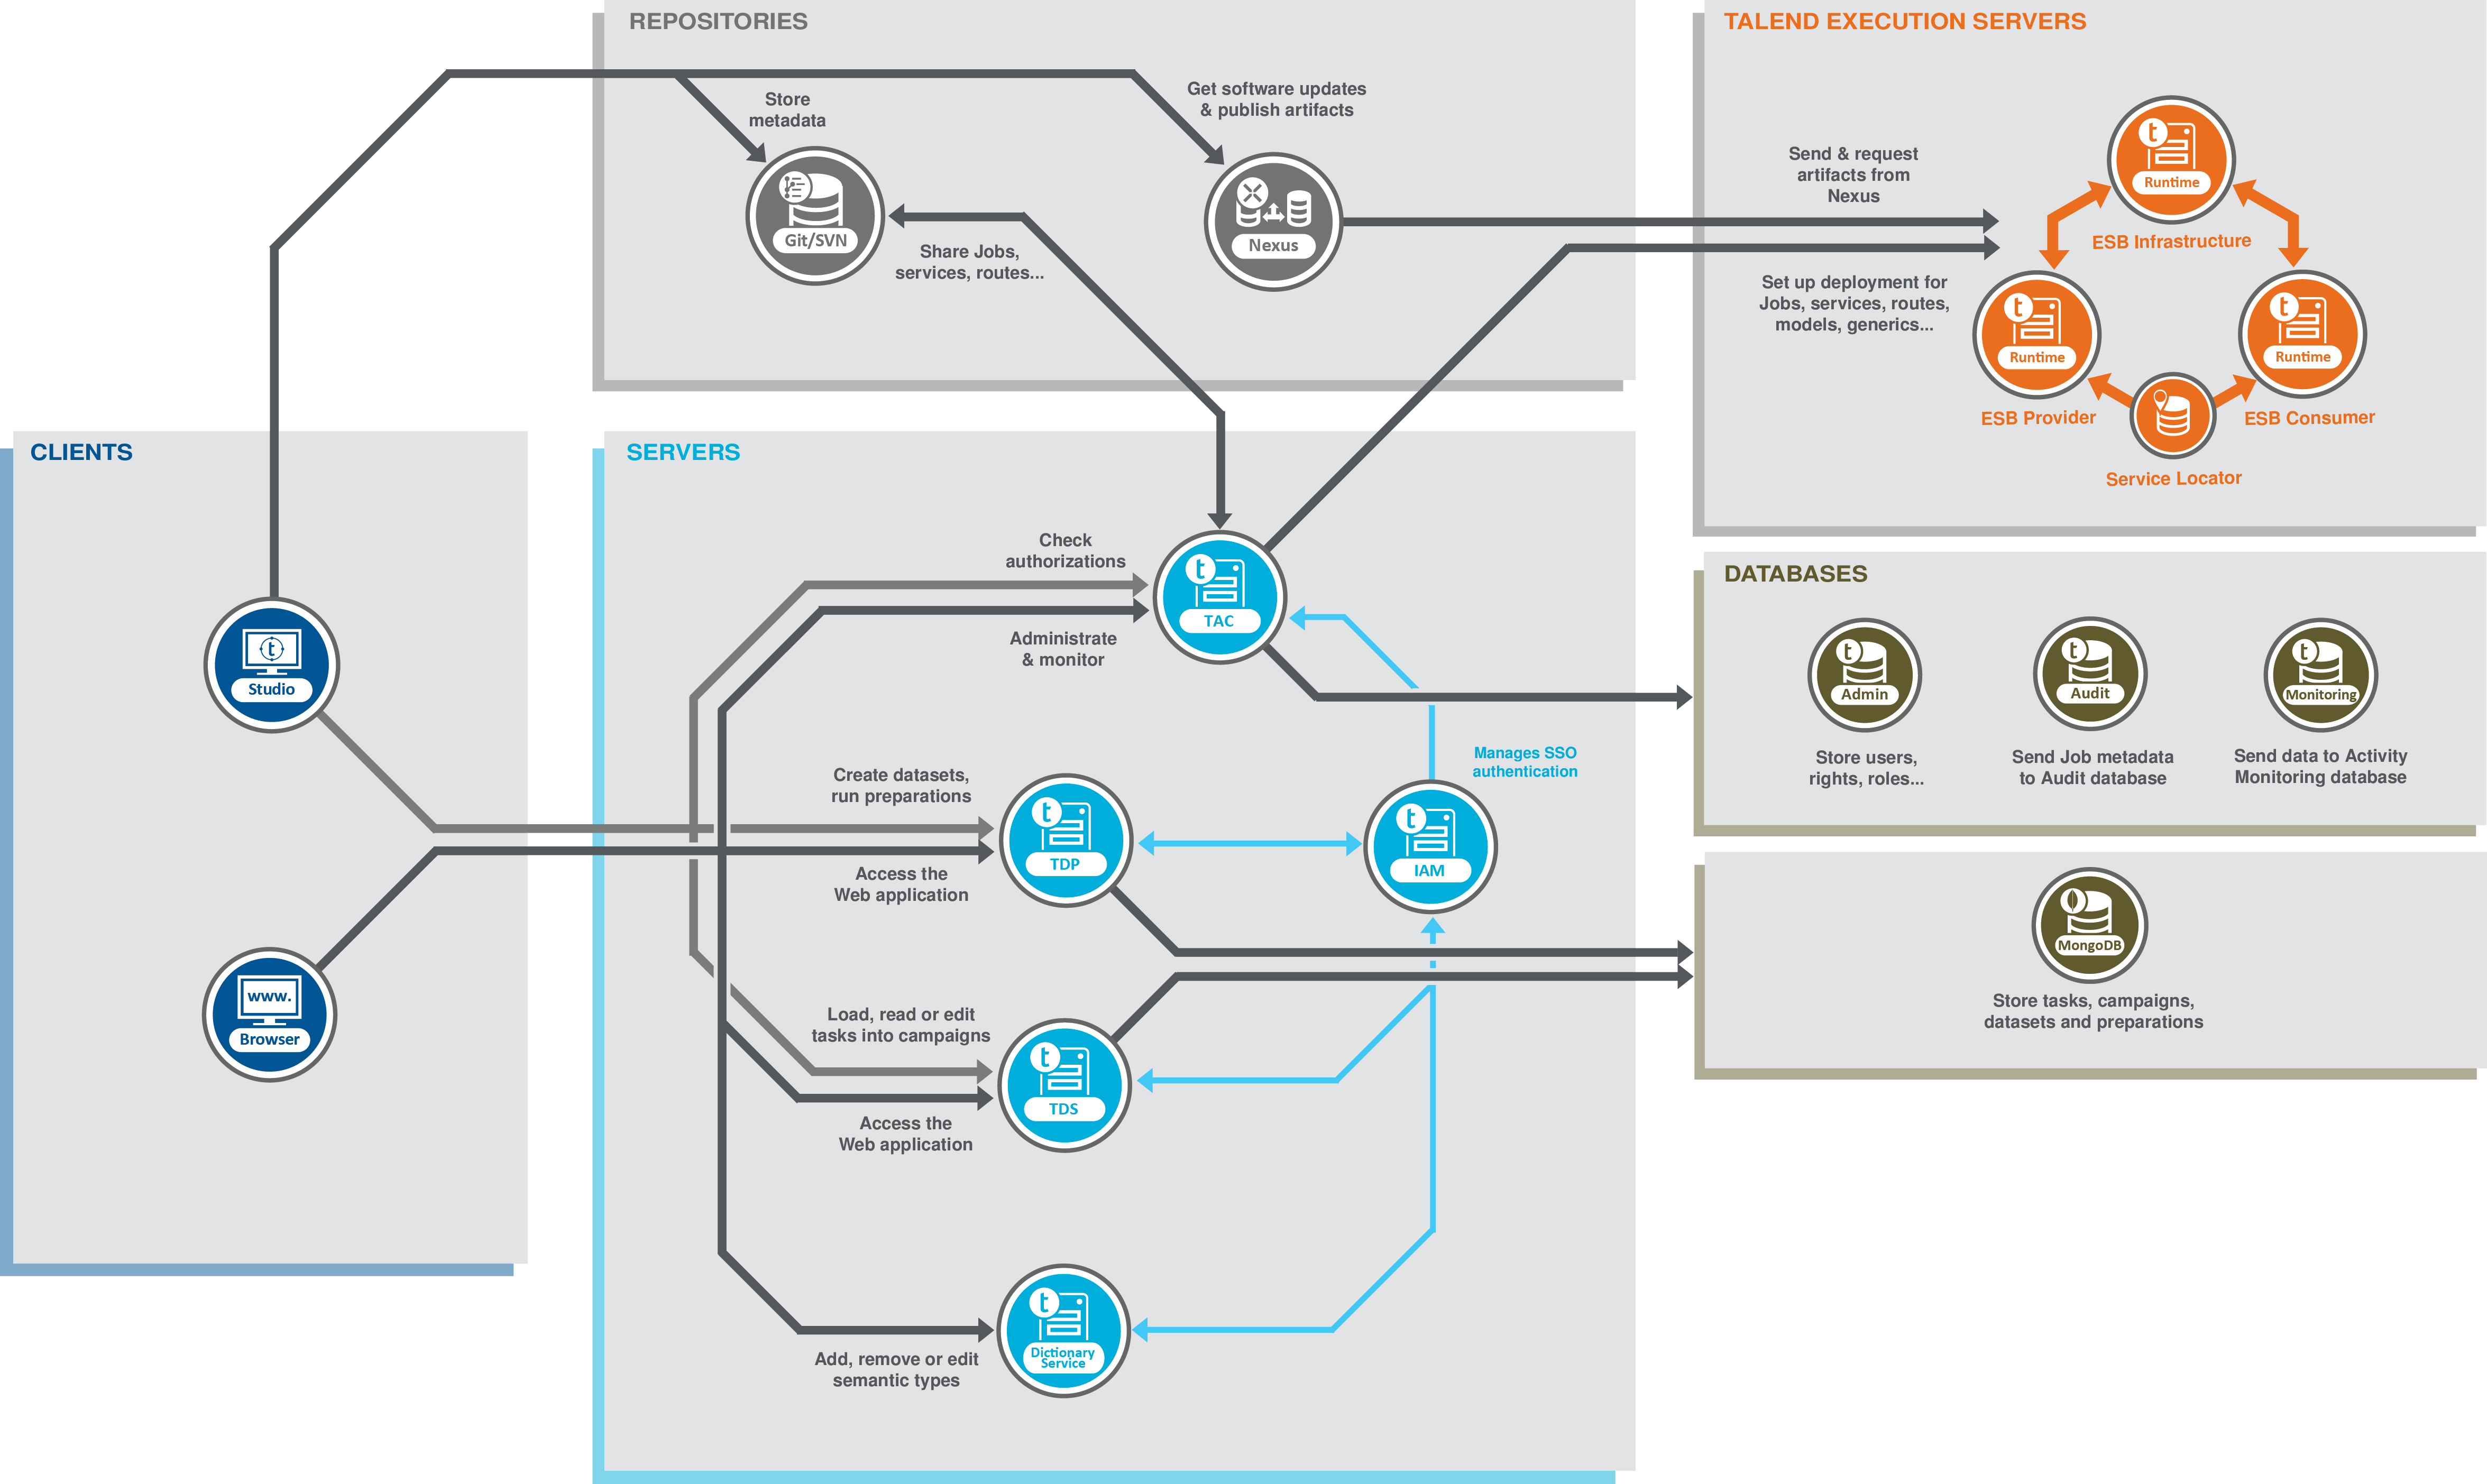
Building and administrating
The CLIENTS block includes one or more Talend Studio APIs and Web browsers that could be on the same or on different machines.
From the Talend Studio API, end-users can carry out technical processes: data integration or data service processes, mediation Routes and services, and publish them on the Artifact Repository.
Talend Studio allows users to work on any project for which they have authorization. For more information, see Creating a project.
From a Web browser, end-users connect to the remotely based Talend Administration Center through a secured HTTP protocol. The end-user category in this description may include developers, project managers, administrators, and any other person involved in building Web, REST, and data services, and mediation Routes.
Each of these end-users will use either Talend Studio or Talend Administration Center or both of them depending on the company policy.
The TALEND SERVERS and DATABASES blocks and the Git gray circle include a web-based Talend Administration Center (application server) connected to two shared repositories: one based on a Git server and one based on a database server (Admin).
Talend Administration Center enables the management and administration of all projects. Administration metadata (user accounts, access rights and project authorization for example) is stored in the database server and project metadata (Jobs, Routines, Routes, Services for example) is stored in the Git server (to easily share them between the different end-users).
Talend Administration Center also includes the servers used by the Talend Web applications, namely Talend Data Preparation and Talend Data Stewardship. The Talend Identity and Access Management server is used to enable Single Sign-On between those applications.
Finally, Talend Administration Center enables you to access and manage the Routes or Services created from Talend Studio and published into the Artifact Repository, and set up and monitor their deployment and execution into the Talend Runtime . For more information, see Executing Services, Routes, and data service Jobs, and applying Profiles from ESB Conductor.
Deploying and executing
- Software Updates available for download.
- Routes and Services that are published from Talend Studio and are ready to be deployed and executed in Talend Runtime.
- One or more Talend
Runtimes (execution container) deployed inside your information system. The Talend Runtime
deploys and executes the technical processes according to the set up defined in the
Talend Administration Center Web
application. Those processes are Routes and Services retrieved from the artifact
repository.
If you have several Talend Runtime on which to deploy the Service and Route artifacts, you will be able to load balance their execution according to your needs. All instances of Talend Runtime will communicate between each other via the Service Locator to identify the one more likely to deploy and execute the artifacts set to deployment in Talend Administration Center. The Talend Runtime elected for the deployment will request for the artifacts to deploy and execute from the artifact repository and the artifact repository will thus send the artifacts requested along with all the dependencies needed for its/their execution to the Talend Runtime, that will deploy and execute it/them.
Monitoring
The Monitoring circle represents the monitoring and the Service Activity Monitoring.
The Service Activity Monitoring allows end-users to monitor service calls. It provides monitoring and consolidated event information that can be used to understand the underlying requests and replies that compose the event, monitor faults that may be unexpectedly generated and support the system management decisions. For more information on the Service Activity Monitoring, see Accessing Service Activity Monitoring.
Did this page help you?
If you find any issues with this page or its content – a typo, a missing step, or a technical error – let us know how we can improve!