
Breakpoint monitoring
Before monitoring your data processing at certain breakpoints, you need to add breakpoints to the relevant Job flow(s).
This will allow you to automatically stop the Job at each defined breakpoint. This way, components and their respective variables can be verified individually and debugged if required.
To add a breakpoint to a link:
-
Right-click it on the design workspace, and select Show Breakpoint Setup on the popup menu.
-
On the Breakpoint view, select the Activate conditional breakpoint check box and set the Conditions in the table.
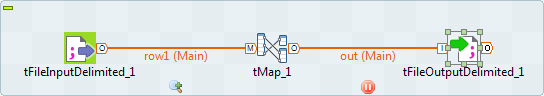
A pause icon displays below the link on which the break is added when you access the Traces mode.
Once the breakpoints are defined, switch to the Traces mode. To do so:
- Click the Run view, and the Debug Run tab.
- Click the down arrow of the Java Debug button and select the Traces Debug option.
- Click the Traces Debug to execute the Job in Traces mode. The data will be processed until the first defined breakpoint.
- Click the Next Breakpoint button to continue the data process
until the next breakpoint.
If, for any reason, you want to stop the Job in progress, simply click the Kill button; if you want to execute the Job to the end, click the Basic Run button.
To remove the displayed monitoring information from the design workspace, click the Clear button in the Debug Run tab.
Did this page help you?
If you find any issues with this page or its content – a typo, a missing step, or a technical error – let us know how we can improve!