
Setting options for system or user-defined indicators
Before you begin
About this task
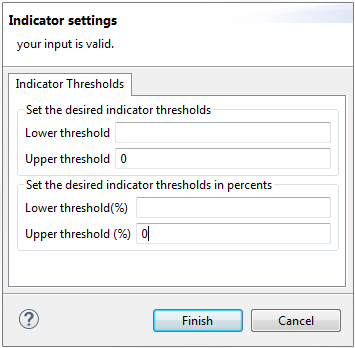
You can define expected thresholds on the indicator's value. The threshold you define is used for measuring the quality of data. If the indicator's value is outside the defined threshold, then the data is of bad quality. You can define only one threshold or no threshold at all. You may set these thresholds either by value or by percentage with respect to the row count.
For more information about setting indicators, see Setting system or user-defined indicators.
Procedure
-
In the Analyzed Columns view in the
analysis editor, click
 next to the indicator.
-
In the dialog box that opens, set the parameters for the given indicator.
For example, if you want to flag if there are null values in the column you analyze, you can set 0 in the Upper threshold field for the Null Count indicator.
Indicators settings dialog boxes differ according to the parameters specific for each indicator. For more information about different indicator parameters, see Indicator parameters.
Did this page help you?
If you find any issues with this page or its content – a typo, a missing step, or a technical error – let us know how we can improve!