Creating a catalog or schema analysis - Cloud - 8.0

Talend Studio User Guide

Version
Cloud
8.0
Language
English
Product
Talend Big Data
Talend Big Data Platform
Talend Cloud
Talend Data Fabric
Talend Data Integration
Talend Data Management Platform
Talend Data Services Platform
Talend ESB
Talend MDM Platform
Talend Real-Time Big Data Platform
Module
Talend Studio
Content
Design and Development
Last publication date
2024-02-29
Available in...

Big Data Platform

Cloud API Services Platform

Cloud Big Data Platform

Cloud Data Fabric

Cloud Data Management Platform

Data Fabric

Data Management Platform

Data Services Platform

MDM Platform

Real-Time Big Data Platform

You can use the Profiling perspective of Talend Studio to analyze one specific catalog or schema in a database, if this entity is used in the physical structure of the database.

The result of the analysis gives analytical information about the content of this schema, for example number of rows, number of tables, number of rows per table and so on.

Before you begin

At least one database connection has been created to connect to a database that uses the "catalog" or "schema" entity. For further information, see Connecting to a database.

Procedure

  1. Under DB connections in the DQ Repository tree view, right-click the catalog or schema for which you want to create content analysis and, select Overview analysis from the contextual menu.
    This example shows how to create a schema analysis.
  2. In the wizard that opens, enter a name for the current analysis.
    Important:

    Do not use the following special characters in the item names: ~ ! ` # ^ * & \\ / ? : ; \ , . ( ) ¥ ' " « » < >

    These characters are all replaced with "_" in the file system and you may end up creating duplicate items.

  3. If required, set the analysis metadata (purpose, description, and author name) in the corresponding fields and click Next.
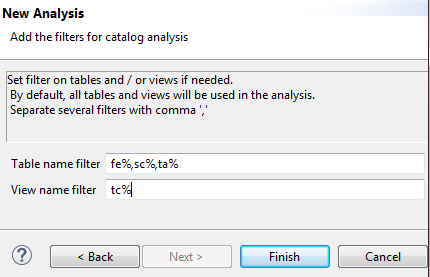
  4. Set filters on the tables and views you want to analyze in their corresponding fields using the SQL language.
    By default, the analysis examines all tables and views in the catalog.
    Example of values in the Table name filter and View name filter fields.
  5. Click Finish.
    A folder for the newly created analysis is listed under Analysis in the DQ Repository tree view, and the analysis editor opens with the defined metadata.
  6. Press F6 to execute the analysis.
    A message opens at the bottom of the editor to confirm that the operation is in progress and analysis results are opened in the Analysis Results view.

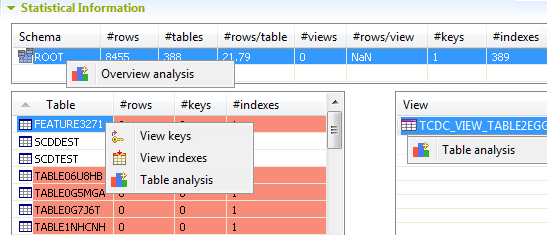
    From the Statistical information view, you can:

    • Click the schema to list all tables included in it along with a summary of their content: number of rows, keys, and user-defined indexes.

      The selected schema is highlighted in blue. Schemas highlighted in red indicate potential problems in data.

    • Right-click a schema and select Overview analysis to analyze the content of the selected item.

    • Right-click a table or a view and select Table analysis to create a table analysis on the selected item. You can also view the keys and indexes of a selected table. For further information, see Displaying keys and indexes of database tables.

    • Click any column header in the analytical table to sort the listed data alphabetically.

    Possible actions from the Statistical information section.