Skip to main content Skip to complementary content

Creating a column set analysis on a delimited file using patterns

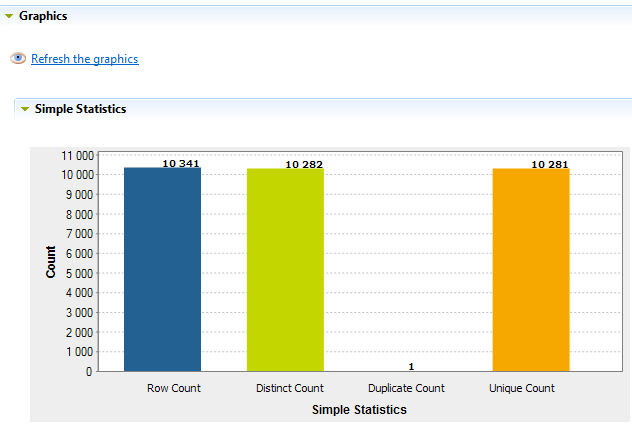
This type of analysis provide simple statistics on the number of records falling in certain categories, including the number of rows, the number of null values, the number of distinct and unique values, the number of duplicates, or the number of blank fields.

For more information about these indicators, see Simple statistics.

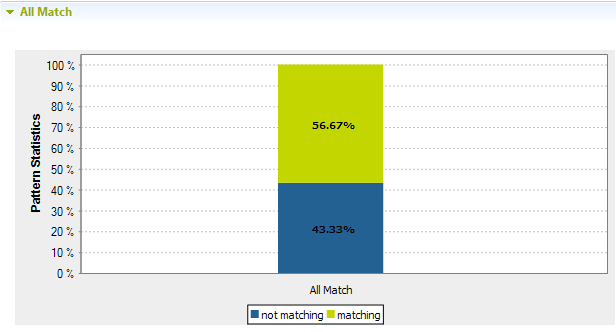
It is also possible to add patterns to this type of analysis and have a single-bar result chart that shows the number of the rows that match "all" the patterns.

Defining the set of columns to be analyzed in a delimited file

You can analyze the content of a set of columns in a delimited file. This set can represent only some of the columns in the defined table or the table as a whole.

You can then execute the created analysis using the Java engine.

Before you begin

At least one connection to a delimited file is set in the Profiling perspective of Talend Studio. For further information, see Connecting to a database.
Information noteWarning: When carrying out this type of analysis, the set of columns to be analyzed must not include a primary key column.

Procedure

  1. From the Profiling perspective, expand Data Profiling.
  2. Right-click Analyses and select New Analysis. The Create New Analysis dialog box opens.
  3. Expand the Table Analysis section, select Column Set Analysis and click Next.
  4. Set column analysis metadata (Purpose, Description and Author) in the corresponding fields and click Next to proceed to the next step.
  5. Expand the FileDelimited connection and browse to the set of columns you want to analyze.
  6. Select the columns to be analyzed, and then click Finish to close this New analysis wizard.
    The analysis editor opens with the defined analysis metadata, and a folder for the newly created analysis is displayed under Analyses in the DQ Repository tree view.
    A sample data is displayed in the Data Preview section and the selected columns are displayed in the Analyzed Column section of the analysis editor.
  7. If required, select another connection from the Connection box in the Analyzed Columns view. This box lists all the connections created in Talend Studio with the corresponding database names.
    By default, the delimited file connection you have selected in the previous step is displayed in the Connection box.
  8. If required, click the Select columns to analyze link to open a dialog box where you can modify your column selection.
    Column Selection dialog box to change the columns to be analyzed.
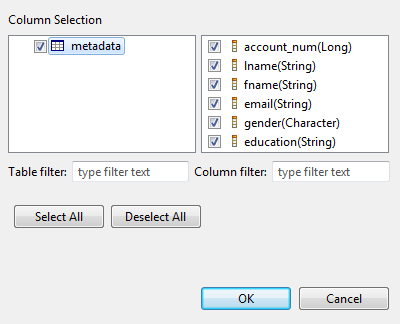
    Information noteNote: You can filter the table or column lists by typing the desired text in the Table filter or Column filter fields respectively. The lists will show only the tables/columns that correspond to the text you type in.
  9. In the column list, select the check boxes of the columns you want to analyze and click OK to proceed to the next step.
    In this example, you want to analyze a set of six columns in the delimited file: account number (account_num), education (education), email (email), first name (fname), last name (lname) and gender (gender). You want to identify the number of rows, the number of distinct and unique values and the number of duplicates.
    Overview of the set of six columns to be analyzed.

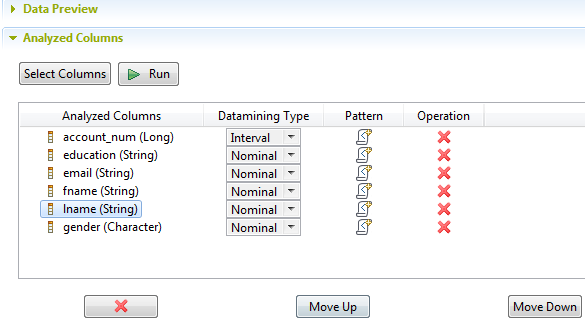
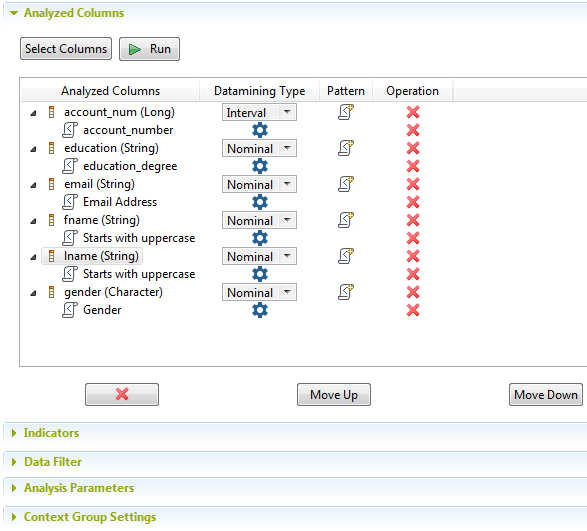
Adding patterns to the analyzed columns in the delimited file

You can add patterns to one or more of the analyzed columns to validate the full record (all columns) against all the patterns, and not to validate each column against a specific pattern as it is the case with the column analysis. The results chart is a single bar chart for the totality of the used patterns. This chart shows the number of the rows that match "all" the patterns.

Information noteWarning: Before being able to use a specific pattern with a set of columns analysis, you must manually set in the patterns settings the pattern definition for Java, if it does not already exist. Otherwise, a warning message will display prompting you to set the definition of the Java regular expression.

Before you begin

An analysis of a set of columns is open in the analysis editor in the Profiling perspective of Talend Studio.

Procedure

Select the check boxes of the expressions you want to add to the selected column, then Click OK.
The added regular expressions display under the analyzed columns in the Analyzed Columns view and the All Match indicator is displayed in the Indicators list in the Indicators view.
The added regular expression is displayed under the column in the Analyzed Columns section.

Finalizing and executing the column set analysis on a delimited file

What is left before executing this set of columns analysis is to define the indicator settings, data filter and analysis parameters.

Before you begin

A column set analysis is defined in the Profiling perspective of Talend Studio.

Procedure

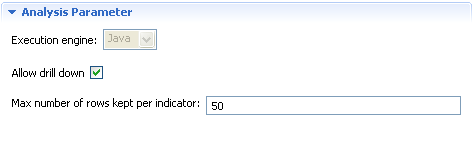
  1. In the Analysis Parameters section, select the Allow drill down check box to store locally the data that will be analyzed by the current analysis.
    Location of the Allow drill down check box in the Analysis Parameters section.
  2. In the Max number of rows kept per indicator field enter the number of the data rows you want to make accessible.
    Information noteNote: The Allow drill down check box is selected by default, and the maximum analyzed data rows to be shown per indicator is set to 50.
  3. Save the analysis and press F6 to execute it.

Results

The editor switches to the Analysis Results view and displays the graphical result corresponding to the Simple Statistics indicators used to analyze the defined set of columns.
Graphical results corresponding to the Simple Statistics indicators in the Simple Statistics section.

When you use patterns to match the content of the set of columns, another graphic is displayed to illustrate the match and non-match results against the totality of the used patterns.

Graphical results showing the matching and non-matching values against the patterns in the All Match section.

Filtering analysis data against patterns

About this task

The procedure to filter the data of the analysis of a delimited file is the same as that for the database analysis. For further information, see Filtering data against patterns.

Did this page help you?

If you find any issues with this page or its content – a typo, a missing step, or a technical error – let us know how we can improve!