
Defining the recommended table analysis
Procedure
-
In the analysis metadata page of the wizard, set the analysis metadata
(Name, Purpose, and
Description) and click Finish.
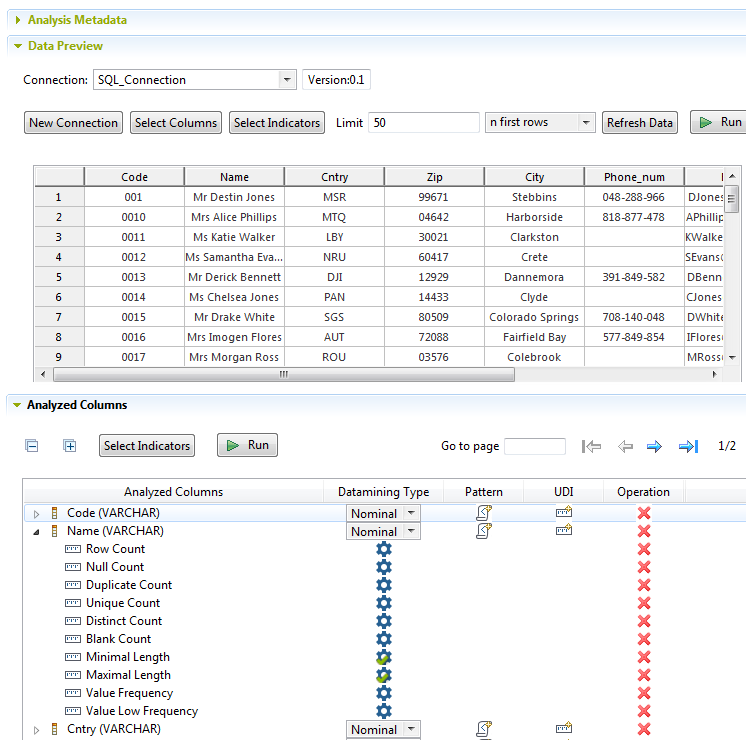
The analysis editor opens with the recommended indicators already assigned to the columns.
-
If required, click Select Indicators to open a
dialog box and modify the indicators assigned to the columns.
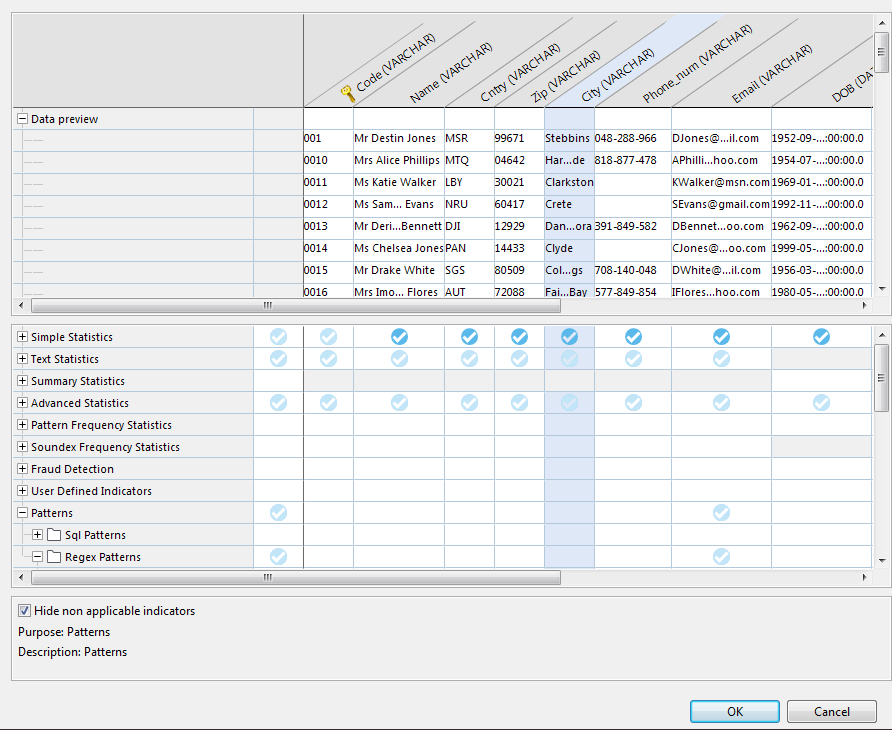 You can also add patterns to the columns from this dialog box.
Results
The ontology repository is enriched with the information about what indicators are used on each type of column. It is also enriched with results such as the minimum and maximum values used on indicators and the thresholds used on patterns.
Results like min and max values are important to define a range on numeric columns. This range is updated in the ontology repository according to the following rules:
- If you do not define a threshold on the min/max indicator in Talend Studio, and if the min/max indicator value is less/greater than the attribute min/max value in the ontology repository, then the attribute min/max value is updated with the new value of the indicator.
- If you set some thresholds on the indicator in Talend Studio, then the min and/or max threshold will update the attribute min and/or max value in the ontology repository every time the analysis is run.
When you try to create a table analysis with similar columns, all the registered indicators and patterns are used on the columns by default.
Did this page help you?
If you find any issues with this page or its content – a typo, a missing step, or a technical error – let us know how we can improve!