
Detecting anomalies in columns (Functional Dependency Analysis)
About this task
This type of analysis detects to what extent a value in a determinant column functionally determines another value in a dependent column.
This can help you identify problems in your data, such as values that are not valid. For example, if you analyze the dependency between a column that contains United States Zip Codes and a column that contains states in the United States, the same Zip Code should always have the same state. Running the functional dependency analysis on these two columns will show if there are any violations of this dependency.
Defining the analysis to detect anomalies in columns
Before you begin
At least one database connection is set in the Profiling perspective of Talend Studio.
Procedure
- In the DQ Repository tree view, expand Data Profiling.
- In the filter field, start typing functional dependency analysis, select Functional Dependency Analysis from the list and click Next.
- Enter a name.
- Optionally, enter the column analysis metadata (Purpose, Description and Author).
- Click Next.
Selecting the columns as either "determinant" or "dependent"
Procedure
-
Expand DB connections, browse to the database
you want to analyze, select it and then click Finish to close the New
Analysis wizard.
The analysis editor opens with the defined analysis metadata, and a folder for the newly created analysis is displayed under Analyses in the DQ Repository tree view.
 The Data Preview section shows a sample data of all the table columns.
 -
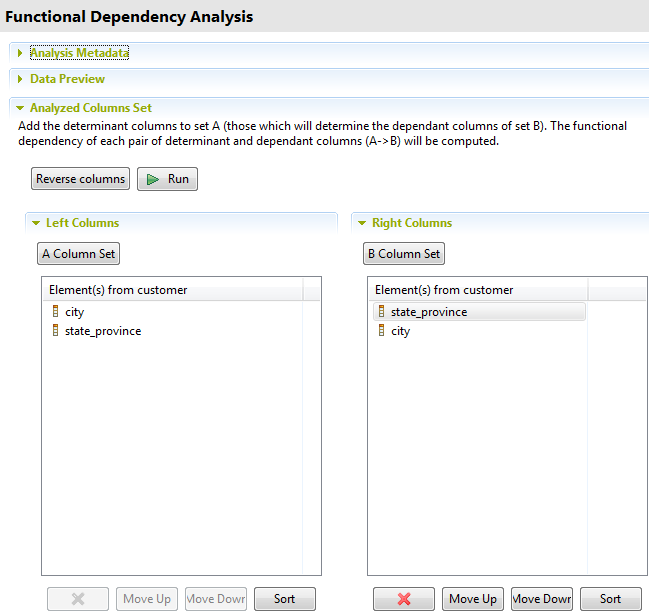
In the Left Column panel, click A Columns Set to open the Column Selection dialog box.
Here you can select the first set of columns against which you want to analyze the values in the dependent columns. You can also drag the columns directly from the DQ Repository tree view to the left column panel.In this example, you want to evaluate the records present in the city column and those present in the state_province column against each other to see if state names match to the listed city names and vice versa.
-
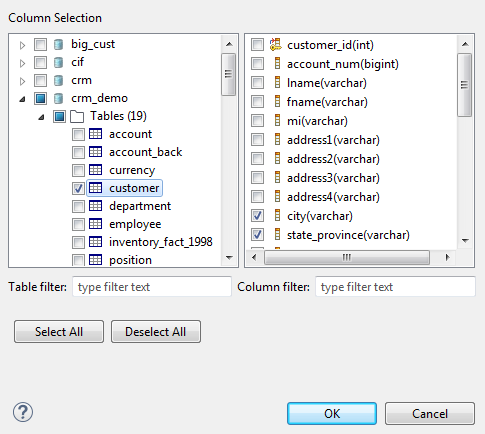
Select the check box next to the columns you want to analyze and click
OK to proceed to the next step.
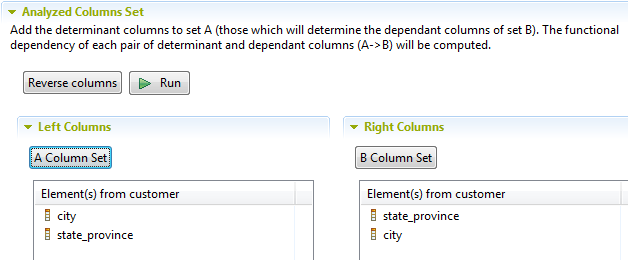
The selected columns are displayed in the Left Columns panel of the Analyzed Columns Set view. In this example, select the city column as the determinant column.
Finalizing and executing the functional dependency analysis
Procedure
-
Save the analysis and press F6 to
execute it.
An information pop-up opens to confirm that the operation is in progress and the analysis editor switches to the Analysis Results view.
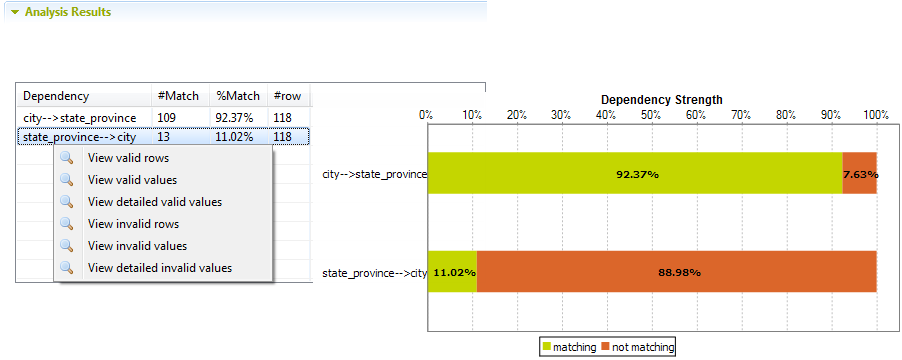 This functional dependency analysis evaluated the records present in the city column and those present in the state_province column against each other to see if the city names match to the listed state names and vice versa. The returned results, in the %Match column, indicate the functional dependency strength for each determinant column. The records that do not match are indicated in red.The #Match column in the result table lists the numbers of the distinct determinant values in each of the analyzed columns. The #row column in the analysis results lists the actual relations between the determinant attribute and the dependent attribute. In this example, #Match in the first row of the result table represents the number of distinct cities, and #row represents the number of distinct pairs (city, state_province). Since these two numbers are not equal, then the functional dependency relationship here is only partial and the ratio of the numbers (%Match) measures the actual dependency strength. When these numbers are equal, you have a "strict" functional dependency relationship, that is to say each city appears only once with each state.Information noteNote: The presence of null values in either of the two analyzed columns will lessen the "dependency strength". The system does not ignore null values, but rather calculates them as values that violates the functional dependency.
Did this page help you?
If you find any issues with this page or its content – a typo, a missing step, or a technical error – let us know how we can improve!