
Matching primary and foreign keys
Before you begin
A database connection is created in the Profiling perspective.
Through this view, you can also access the actual analyzed data via the Data Explorer.
- View match rows: access a list of all rows that could be matched in the two identical column sets.
- View not match rows: access a list of all rows that could not be matched in the two identical column sets.
- View rows: access a list of all rows in the two identical column sets
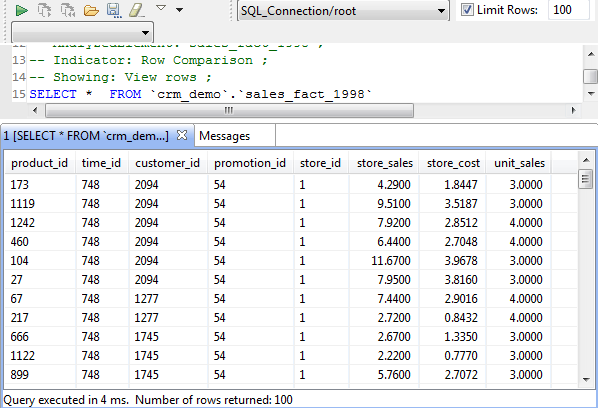
The figure below illustrates in the data explorer the list of all analyzed rows in the two columns.
From the SQL editor, you can save the executed query and list it under the folders in the DQ Repository tree view if you click the save icon on the editor toolbar. For more information, see Saving the queries executed on indicators.
Defining the analysis to match primary and foreign keys in tables
Procedure
-
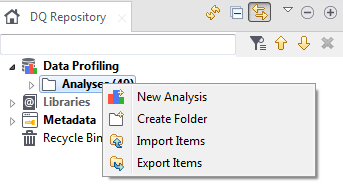
Right-click the Analyses folder and select
New Analysis.
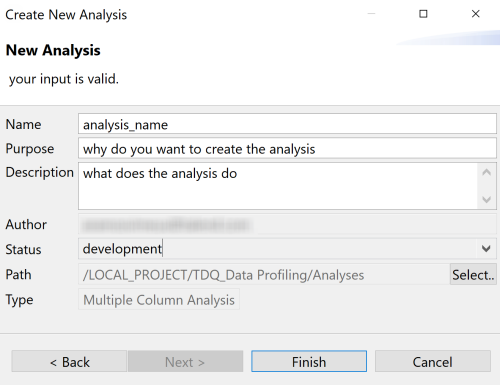
 The Create New Analysis wizard opens.
 -
Set the analysis metadata (purpose, description, and author name) in the
corresponding fields and click Finish.
 A file for the newly created analysis is displayed under the Analysis folder in the DQ Repository tree view. The analysis editor opens with the defined analysis metadata.
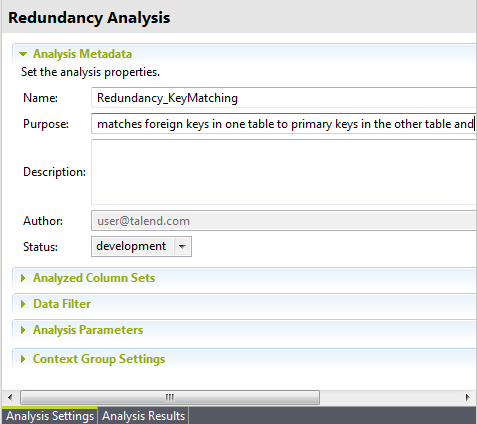
Selecting the primary and foreign keys
Procedure
-
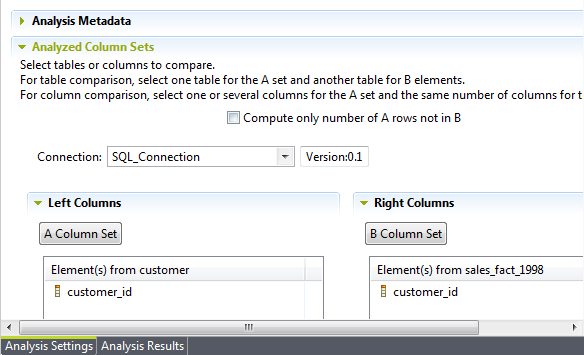
Click Analyzed Column Sets to display the
corresponding view.
In this example, you want to match the foreign keys in the customer_id column of the sales_fact_1998 table with the primary keys in the customer_id column of the customer table, and vice versa. This will explore the relationship between the two tables to show us for example if every customer has an order in the year 1998.
-
Browse the catalogs/schemas in your database connection to reach the table
holding the column you want to match.
In this example, the column to be analyzed is customer_id that holds the foreign keys.
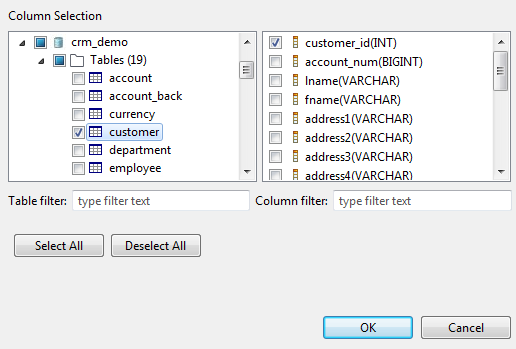 You can filter the table or column lists by typing the desired text in the Table filter or Column filter fields respectively. The lists will show only the tables/columns that correspond to the text you type in.
Results
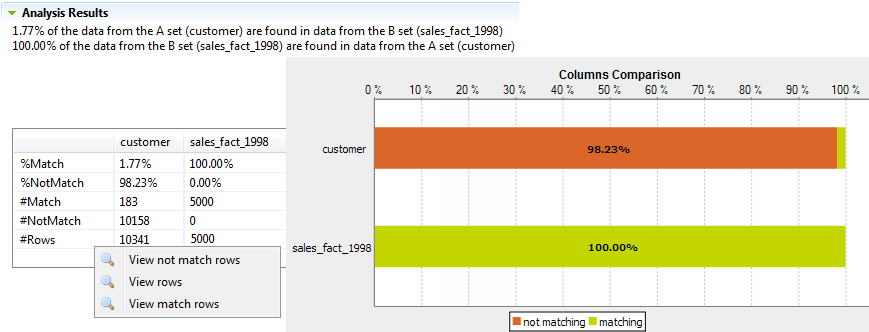
In this example, every foreign key in the sales_fact_1998 table is identified with a primary key in the customer table. However, 98.22% of the primary keys in the customer table could not be identified with foreign keys in the sales_fact_1998 table. These primary keys are for the customers who did not order anything in 1998.
Did this page help you?
If you find any issues with this page or its content – a typo, a missing step, or a technical error – let us know how we can improve!