
Opening the Kibana dashboard
You can open the Kibana dashboard to visualize the content of the ontology
repository.
Procedure
-
Select Semantic Repository
Dashboard from the list.
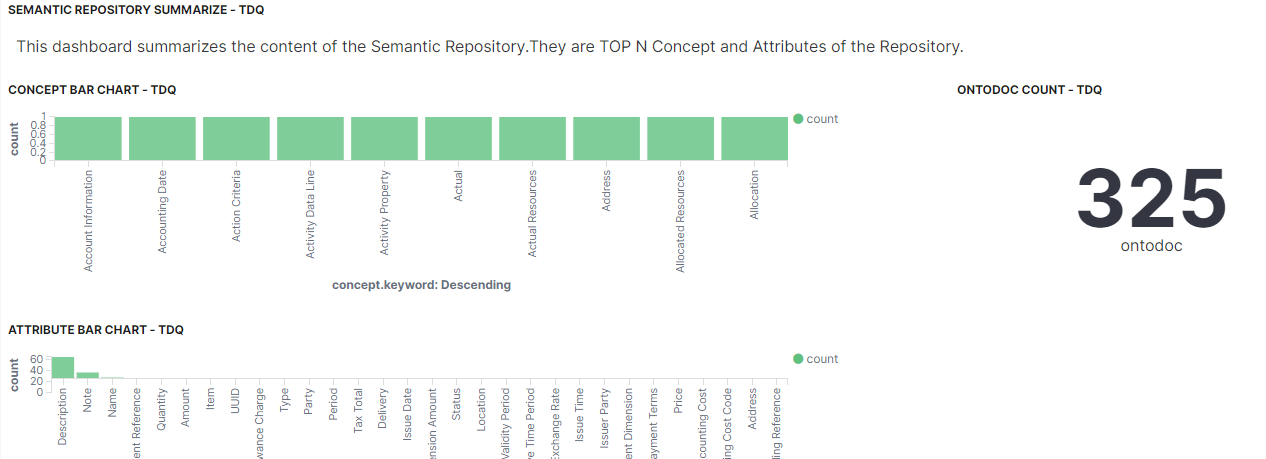
The dashboard displays the most frequent concepts and the attributes stored in the ontology repository.
-
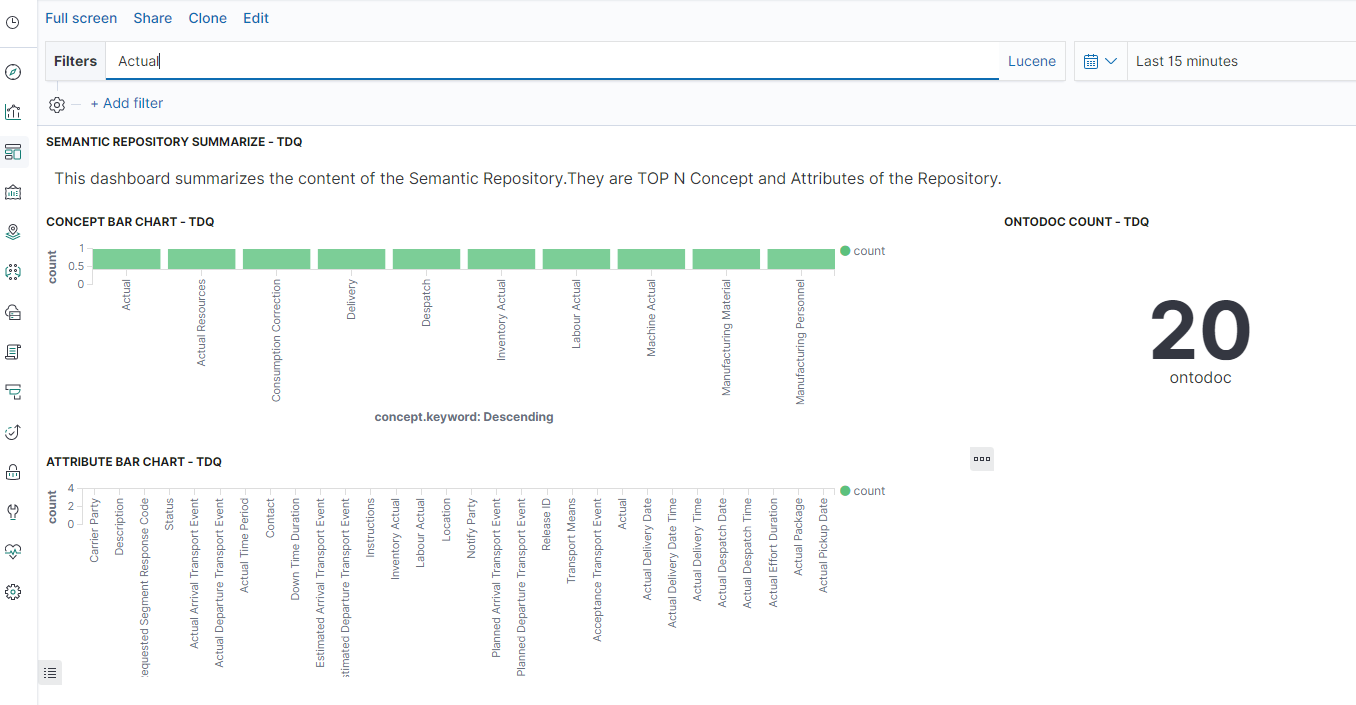
Use the search field on top of the dashboard to search for a concept, an attribute,
and filter the results listed in the dashboard.
Did this page help you?
If you find any issues with this page or its content – a typo, a missing step, or a technical error – let us know how we can improve!