Setting the indicator definition and category - Cloud - 8.0

Talend Studio User Guide

Version
Cloud
8.0
Language
English
Product
Talend Big Data
Talend Big Data Platform
Talend Cloud
Talend Data Fabric
Talend Data Integration
Talend Data Management Platform
Talend Data Services Platform
Talend ESB
Talend MDM Platform
Talend Real-Time Big Data Platform
Module
Talend Studio
Content
Design and Development
Last publication date
2024-02-29
Available in...

Big Data Platform

Cloud API Services Platform

Cloud Big Data Platform

Cloud Data Fabric

Cloud Data Management Platform

Data Fabric

Data Management Platform

Data Services Platform

MDM Platform

Real-Time Big Data Platform

Procedure

  1. Click Indicator Category and select from the list a category for the indicator.
    The selected category determines the columns expected in the result set of the analysis that uses the user-defined indicator.
    The table below explains available categories.
    Indicator category Description Expected query results
    User Defined Match Evaluates the number of data matching a condition. The result set should have one row and two columns. The first column contains the number of values that match and the second column the total count.
    User Defined Frequency Evaluates the frequency of records using user-defined indicators for each distinct record. The result set should have 0 or more rows and two columns. The first column contains a value and the second the frequency (count) of this value.
    User Defined Real Value Evaluates real function of data. The result set should have one row and one column that contain a real value.
    User Defined Count (by-default category) Analyzes the quantity of records and returns a row count. The result set should have one row and one column that contain the row count.
  2. Click Indicator Definition and then click the [+] button.
  3. From the Database list, select a database on which to use the indicator.
    If the indicator is simple enough to be used in all databases, select Default in the database list.
  4. Enter the database version in the Version field.
  5. Define the SQL statement for the indicator you want to create:
    1. Click the Edit... button next to the SQL Template field.

      The Edit Expression dialog box opens.

      Overview of the Edit Expression dialog box.
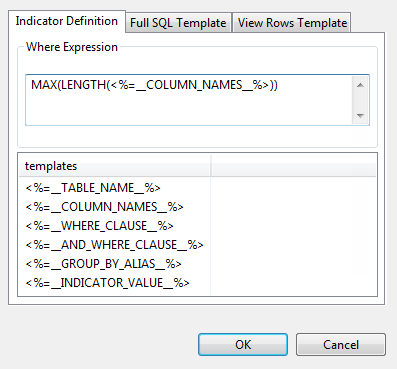
    2. In the Indicator Definition view, enter the SQL expressions you want to use in matching and analyzing data. You can drop templates from the templates list to complete the expression.

      Example

      Set the expression to measure the maximal length of the values in a column as shown in the above capture.

      This view may have several input fields, one for each column expected by indicator category. For example, if you select the User Defined Count category, you will have only a Where Expression field; while if you select the User Defined Match category, you will have two fields: Matching Expression and Where Expression.

      The SQL expressions are automatically transformed into a complete SQL template in the Full SQL Template view.

      Overview of the Full SQL Template tab.

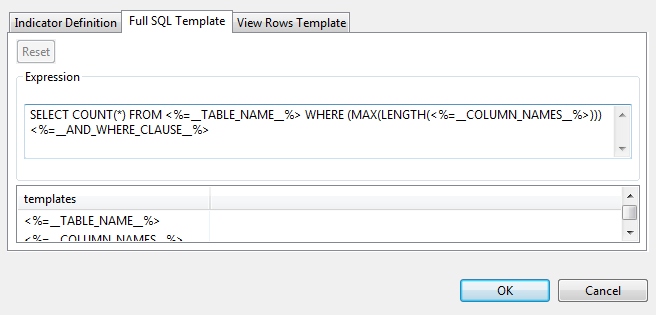
      Also, the SQL expressions are automatically transformed into templates to view rows/values. Different tabs are available in the dialog box depending on what indicator category is selected.

      If you edit the SQL expression(s) in the Indicator Definition view, the templates will be updated accordingly in the other tabs.

    3. Use the Reset button to revert all templates according to the content of the Indicator Definition tab.
    4. Click OK.
      The dialog box is closed and the SQL template is displayed in the indicator editor.
    5. Use the [+] button and follow the same steps to add as many indicator definitions as needed.
      Note: You do not need to define any parameters in the Indicator Parameters view when the user-defined indicator contains only SQL templates. These parameters are used only when indicators have Java implementation. For further information, see Defining Java user-defined indicators.
  6. Click the save icon on top of the editor.

Results

The indicator is listed under the User Defined Indicators folder in the DQ Repository tree view. You can use this indicator to analyzed columns through a simple drag-and-drop operation from the DQ Repository tree view to the columns listed in the editor.

If an analysis with a user-defined indicator runs successfully at least one time and later the indicator definition template for the database is deleted, the analysis does not fail. It keeps running successfully because it uses the previously generated SQL query.