
Showing JVM resource usage during Job or Route execution
About this task
The Memory Run vertical tab of the Run view of your Talend Studio allows you to monitor real-time JVM resource usage during Job or Route execution, including memory consumption and host CPU usage, so that you can take appropriate actions when the resource usage is too high and results in low performance of your Talend Studio, such as increasing the memory allocated to the JVM, stopping unnecessary Jobs or Routes, and so on.
To monitor JVM resource usage at Job or Route execution, do the following:
Procedure
-
Click Run to run the Job or Route.
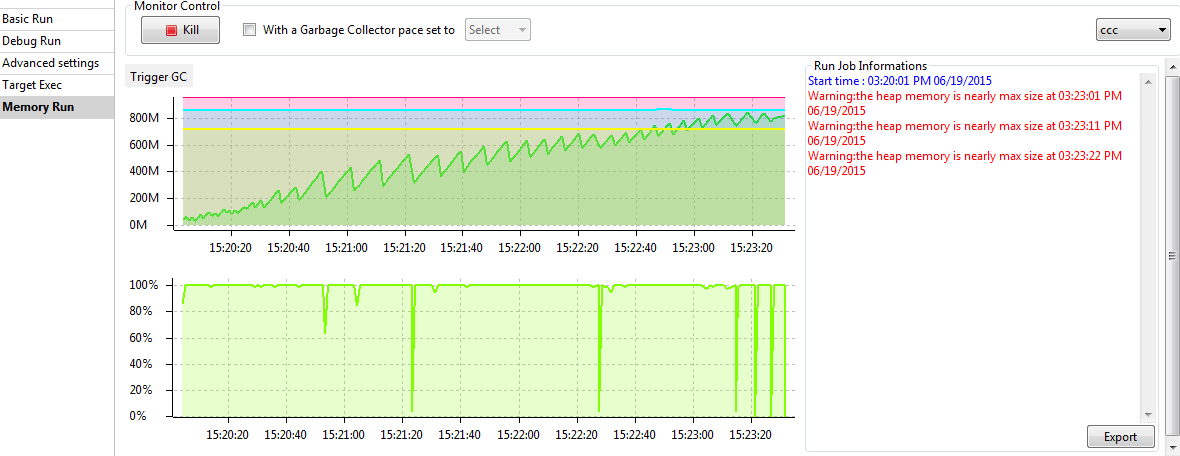
You can click Run on the Memory Run tab to monitor the JVM resource usage by your Job or Route at any time even after you launch your Job or Route from the Basic Run tab.Talend Studio displays curve graphs showing the JVM heap usage and CPU usage respectively during the Job or Route execution. Warning messages are shown in red on the Job execution information area when the relevant thresholds are reached.
Did this page help you?
If you find any issues with this page or its content – a typo, a missing step, or a technical error – let us know how we can improve!