
Data quality rules tile overview
The Data quality rules tile gives you insights on the overall compliance of your data according to the data quality rules. The results of the data quality rules influence the Completeness and Validity axes of the Talend Trust Score™.
For more information on data quality rules, see Managing data quality rules.
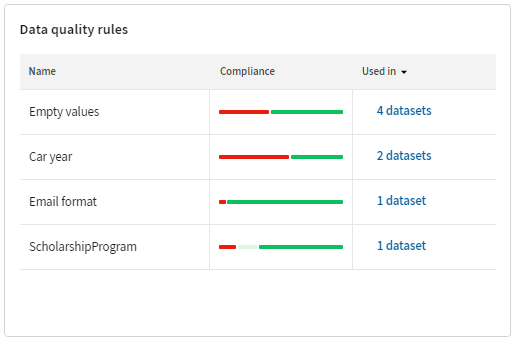
| Color | Description |
|---|---|
| Red | The values are invalid. They fulfill the condition but not the validation expression or the rule cannot be executed on those values. For example, if the rule must compare a string with a number. |
| Light green | The values are not applicable. They do not fulfill the condition and no alternative validation expression has been defined. |
| Green | The values are valid. They fulfill all rule statements. |
Hover over a color to see the total number and percentage of invalid, non-applicable, and valid values.
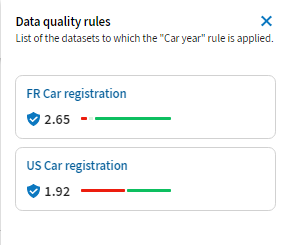
As in the tile, you can see up to three colors: red, light green, and green. Hover over each color to see the number and percentage of invalid, non-applicable, and valid values in each dataset. The description of each color is the same as in the tile. See the table above.
Did this page help you?
If you find any issues with this page or its content – a typo, a missing step, or a technical error – let us know how we can improve!