
Dataset quality
Several visual indicators let you have a precise idea of the quality of your data.
- The semantic type of the column.
- The data quality rules applied to one or more fields.
| Color | Description |
|---|---|
| Red | The values do not match the column format or fulfill the rule condition but not the validation expression or the rule cannot be executed on those values. For example, if the rule must compare a string with a number. For more information on the errors, click the red vertical bar next to the value. |
| Gray | The cells are empty or the values are not applicable for the rule. They do not fulfill the condition and no alternative validation expression has been defined. |
| Green | The values match the column format or they fulfill all rule statements. |
The quality indicators can be found at the following locations:
- From the dataset list:
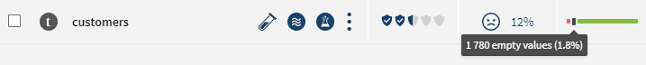
The quality of your datasets is displayed in the form of a quality bar. Hover over a color to display the quality statistics of the dataset. The percentage, and exact number of values, that are invalid, empty, or valid in the sample is displayed.
- From the dataset overview: In the Data quality tile of the dataset overview, you will find bar charts showing the exact percentage and number of empty, valid, and invalid values across the dataset sample. Each category is displayed in a dedicated chart.
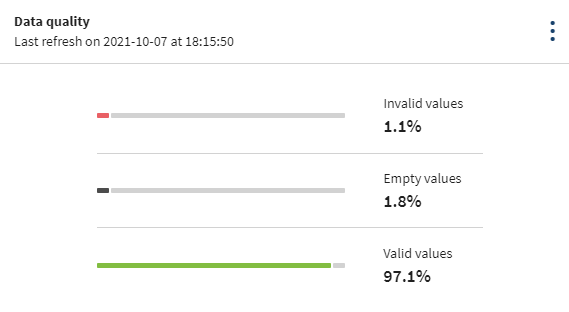
When the sample refresh fails, an error message is displayed in the tile. For more information, see Issues on the sample refresh.
In the Data quality rules tile of the dataset overview, the compliance bar shows the exact percentage and number of invalid, non-applicable, and valid values across the dataset sample.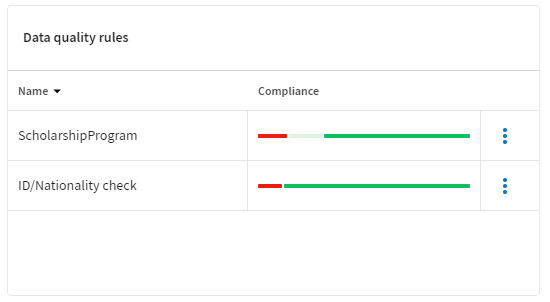
If the warning
 or error
  icons are displayed next to the rule name, see Issues in the Data
quality rules tile or the dataset header.
icons are displayed next to the rule name, see Issues in the Data
quality rules tile or the dataset header. - From the dataset sample header:
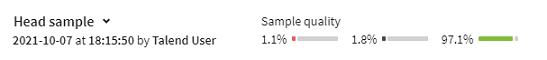
In the header above your dataset, you can also find bar charts showing the repartition of invalid, empty, and valid values across the dataset sample. Each category is displayed in a dedicated chart. Hover over a chart for detailed statistics.
- From the quality bar:
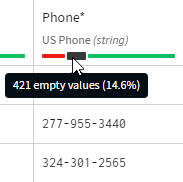 When using the grid view of your dataset, you can see that each column header contains a quality bar. The statistics displayed here applies to each specific column. Hover over each color for detailed statistics of each category. In the grid view, cells containing invalid values according to the column semantic type are displayed with a red vertical bar. Click this bar to get more information on the invalid value.
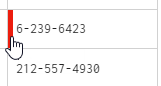
Did this page help you?
If you find any issues with this page or its content – a typo, a missing step, or a technical error – let us know how we can improve!