
Filtering tasks using the quality bar
You can use the quality bar to filter data and list only the tasks you want to resolve or you want to assign or delegate to specific data stewards.
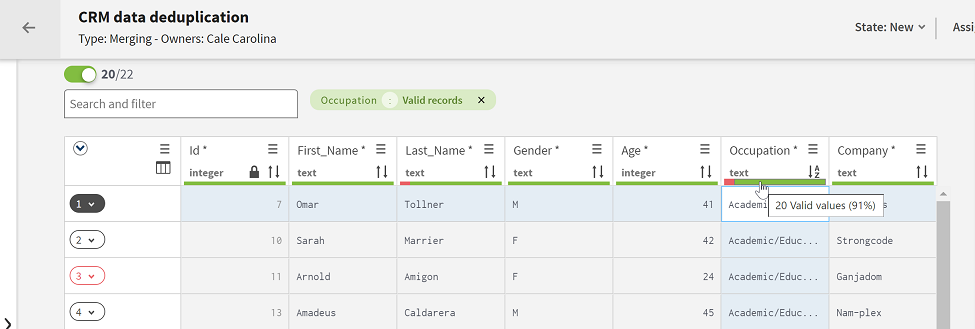
The quality bar is a bar on top of each of the columns in a tasks list. It indicates data quality using colors. The quality bar displays the percentage and number of valid, invalid, or empty values in the column.
The quality bar is available in Resolution and Merging campaigns.
Procedure
-
Point to a color in the quality bar on top of one of the
columns to display the number of the values which match the color
indication.
Color Description Red The values are invalid according to a constraint or data quality rule. Gray The fields are empty. The empty values for a mandatory field are marked as red. Green The values are valid according to the constraints and data quality rules. The non-applicable values from data quality rules are marked as green. A non-applicable value is a value that does not fulfill the condition of the data quality rule, and no alternative validation expression has been defined.
Did this page help you?
If you find any issues with this page or its content – a typo, a missing step, or a technical error – let us know how we can improve!