
Accessing the detailed view of the database column analysis
Before you begin
About this task
To access a more detailed view of the analysis results of the procedures outlined in Defining the columns to be analyzed and setting indicators and Finalizing and executing the column analysis, do the following:
Procedure
-
Click the name of the analyzed column for which you want to
open the detailed results.
Information noteTip: The display of the Analysis Results view depends on the parameters you set in the Preferences window. For more information, see Setting preferences of analysis editors and analysis results.The detailed analysis results view shows the generated graphics for the analyzed columns accompanied with tables that detail the statistic results.Below are the tables that accompany the Frequency and Simple Statistics graphics in the Analysis Results view for the analyzed email column.
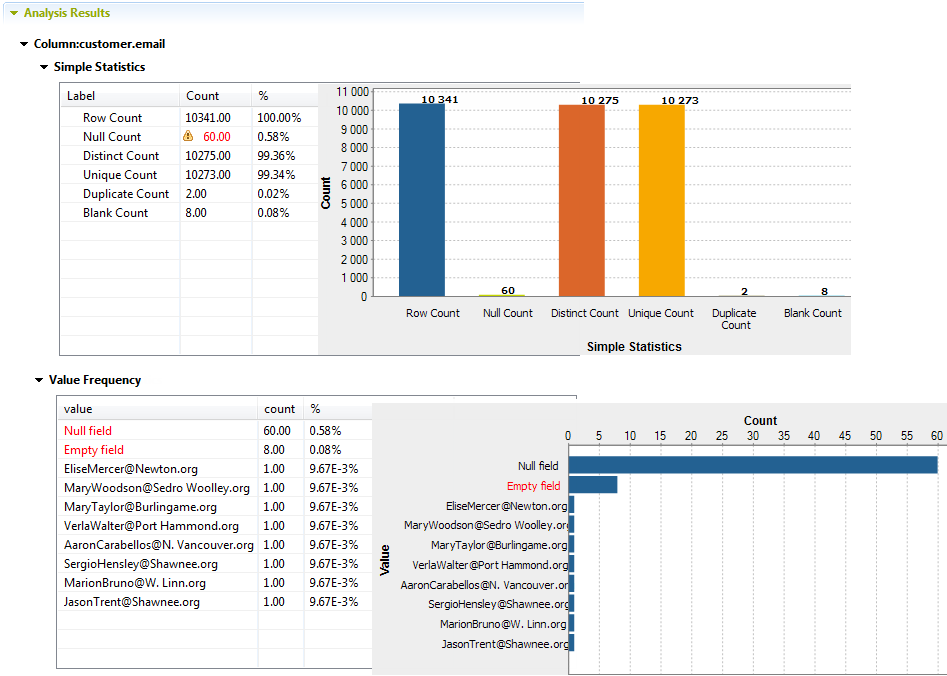 In the Simple Statistics table, if an indicator value is displayed in red, this means that a threshold has been set on the indicator in the column analysis editor and that this threshold has been violated. For further information about data thresholds, see Setting options for system or user-defined indicators.Below are the tables and the graphics representing the Benford's law statistics in the Analysis Results view for the analyzed total_sales column.
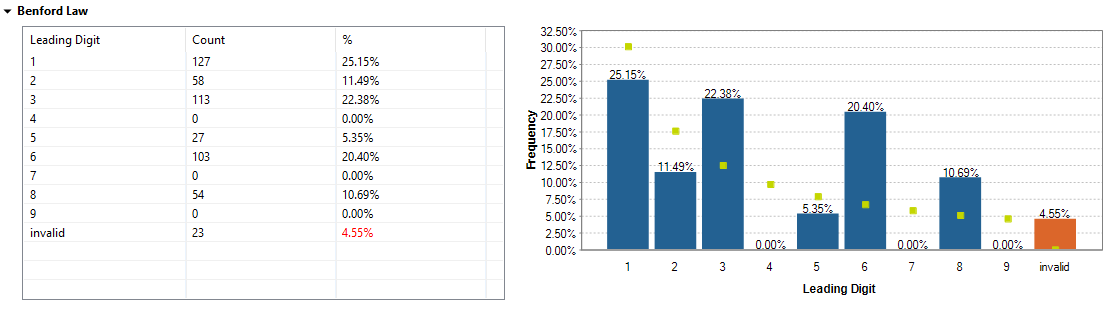 For further information about the Benford's law statistics usually used as an indicator of accounting and expenses fraud in lists or tables, see Fraud Detection.
Did this page help you?
If you find any issues with this page or its content – a typo, a missing step, or a technical error – let us know how we can improve!