
Creating a catalog or schema analysis
You can use the Profiling perspective of Talend Studio to analyze one specific catalog or schema in a database, if this entity is used in the physical structure of the database.
The result of the analysis gives analytical information about the content of this schema, for example number of rows, number of tables, number of rows per table and so on.
Before you begin
At least one database connection has been created to connect to a database that uses the "catalog" or "schema" entity. For further information, see Connecting to a database.
Procedure
-
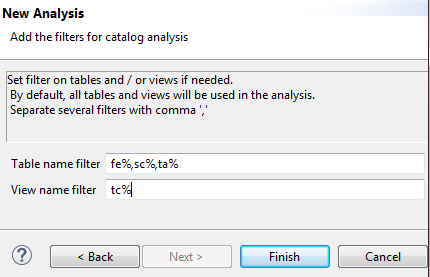
Set filters on the tables and views you want to analyze in their corresponding
fields using the SQL language.
By default, the analysis examines all tables and views in the catalog.
-
Press F6 to execute the analysis.
A message opens at the bottom of the editor to confirm that the operation is in progress and analysis results are opened in the Analysis Results view.
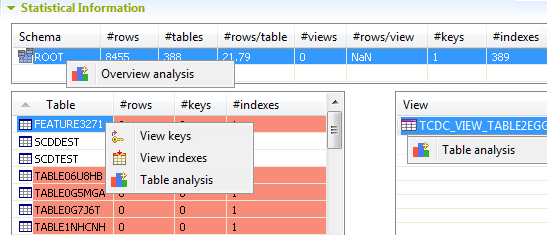
From the Statistical information view, you can:
-
Click the schema to list all tables included in it along with a summary of their content: number of rows, keys, and user-defined indexes.
The selected schema is highlighted in blue. Schemas highlighted in red indicate potential problems in data.
-
Right-click a schema and select Overview analysis to analyze the content of the selected item.
-
Right-click a table or a view and select Table analysis to create a table analysis on the selected item. You can also view the keys and indexes of a selected table. For further information, see Displaying keys and indexes of database tables.
-
Click any column header in the analytical table to sort the listed data alphabetically.
-
Did this page help you?
If you find any issues with this page or its content – a typo, a missing step, or a technical error – let us know how we can improve!