
Creating a table analysis with an SQL business rule with a join condition
About this task
In some cases, you may need to analyze database tables or views using a SQL business rule that has a join clause that combines records from two tables in a database. This join clause will compare common values between two columns and give a result dataset. Then the data in this set will be analyzed against the business rule.
Depending on the analyzed data and the join clause itself, several different results of the join are possible, for example #match + #no match > #row count, #match + #no match < #row count or #match + #no match = #row count.
The example below explains in detail the case where the dataset in the join result is bigger than the row count (#match + #no match > #row count) which indicates duplicates in the processed data.
- At least one SQL business rule has been created in the Profiling perspective of Talend Studio.
- At least one database connection is set in the Profiling perspective of Talend Studio.
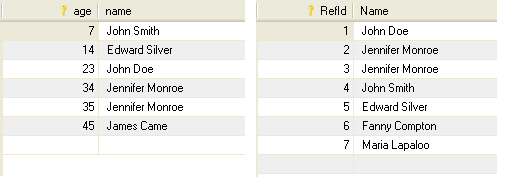
In this example, you want to add the SQL business rule created in Creating an SQL business rule to a Person table that contains the age and name columns. This SQL business rule will match the customer ages to define those who are older than 18. The business rule also has a join condition that compares the "name" value between the Person table and another table called Person_Ref through analyzing a common column called name.
The result set may give duplicate rows as it is the case here. Thus the results of the analysis may become a bit harder to understand. The analysis here will not analyze the rows of the table that match the business rule but it will run on the result set given by the business rule.
Procedure
-
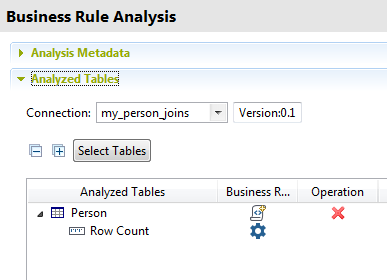
Define the table analysis and select the table you want to analyze.
The selected table is listed in the Analyzed Tables view.
-
To add the business rule with the join condition to the selected table, click
 next to the table name.
This business rule has a join condition that compares the "name" value between two different tables through analyzing a common column.
next to the table name.
This business rule has a join condition that compares the "name" value between two different tables through analyzing a common column. -
Save the analysis and press F6 to
execute it.
An information pop-up opens to confirm that the operation is in progress and the analysis editor switches to the Analysis Results view.
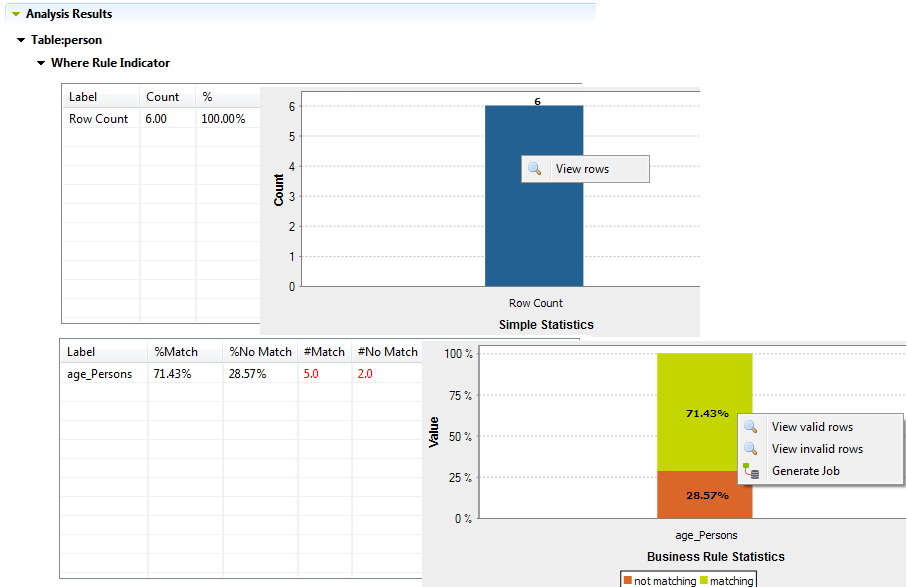
All age records in the selected table are evaluated against the defined SQL business rule. The analysis results has two bar charts: the first is a row count indicator that shows the number of rows in the analyzed table, and the second is a match and non-match indicator that indicates the age records from the "analyzed result set" that do not match the criteria (age below 18).
Information noteNote: If a join condition is used in the SQL business rule, the number of the rows of the join (#match + # no match) can be different from the number of the analyzed rows (row count). -
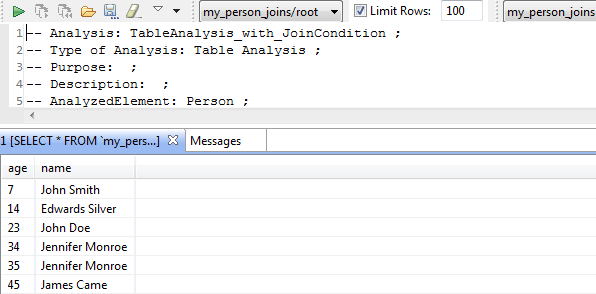
Right-click the Row Count row in the
first table and select View rows.
The SQL editor opens in Talend Studio to display a list of the analyzed rows.
-
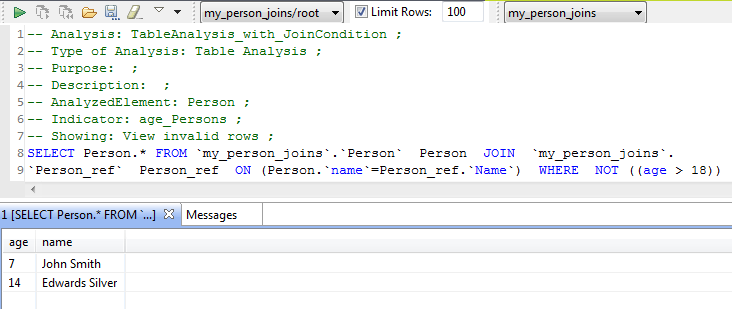
Select an option:
Option Description View valid rows Access a list in the SQL editor of all valid rows measured against the pattern used on the selected table. View invalid rows Access a list in the SQL editor of all invalid rows measured against the pattern used on the selected table. Analyze duplicates Generates a ready-to-use analysis that analyzes duplicates in the table, if any, and give the row and duplicate counts. Generate Job Generate a Job that uses the Extract Load Transform process to write the valid or invalid rows of the analyzed table in an output file. This option is available for Microsoft SQL Server, MySQL, Oracle, and PostgreSQL connections. Below is the list of the invalid rows in the analyzed table.
-
To better understand the Business Rule
Statistics bar chart in the analysis results, do the
following:
-
In the analysis editor, right-click the business rule and select View executed query.
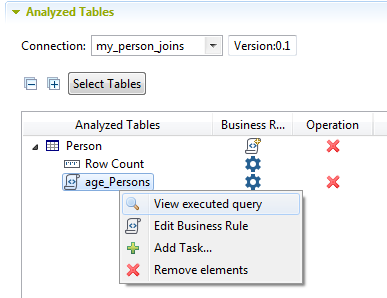
The SQL editor opens in Talend Studio.
-
In the top left corner of the editor, click
 to execute the query.
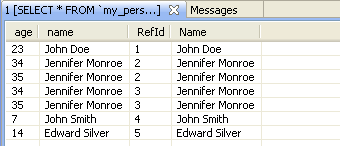
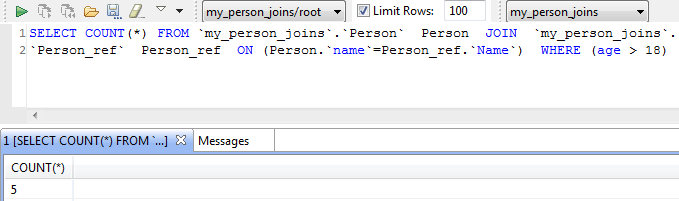
The query result, that is the analyzed result set, is listed in the bottom part of the editor.
-
Go back to the analysis editor and click the Analysis Results tab at the bottom of the editor to open a detail view of the analysis results.
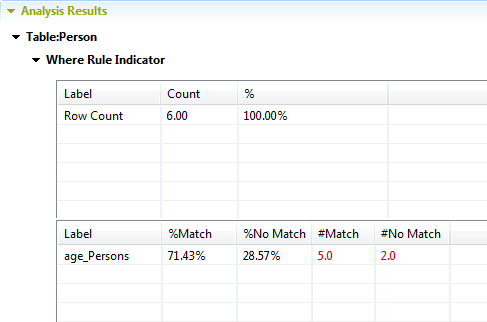
The analyzed result set may contain more or fewer rows than the analyzed table. In this example, the number of match and non-match records (5 + 2 = 7) exceeds the number of analyzed records (6) because the join of the two tables generates more rows than expected.
Here 5 rows (71.43%) match the business rule and 2 rows do not match. Because the join generates duplicate rows, this result does not mean that 5 rows of the analyzed table match the business rule. It only means that 5 rows among the 7 rows of the result set match the business rule. Actually, some rows of the analyzed tables may not be even analyzed against the business rule. This happens when the join excludes these rows. For this reason, it is advised to check for duplicates on the columns used in the join of the business rule in order to make sure that the join does not remove or add rows in the analyzed result set. Otherwise the interpretation of the result is more complex.
In the Analysis Results view, if the number of match and non-match records exceeds the number of analyzed records, you can generate a ready-to-use analysis that will analyze the duplicates in the selected table.
-
In the analysis editor, right-click the business rule and select View executed query.
Did this page help you?
If you find any issues with this page or its content – a typo, a missing step, or a technical error – let us know how we can improve!