
An example of an evolution report
Before you begin
About this task
Procedure
-
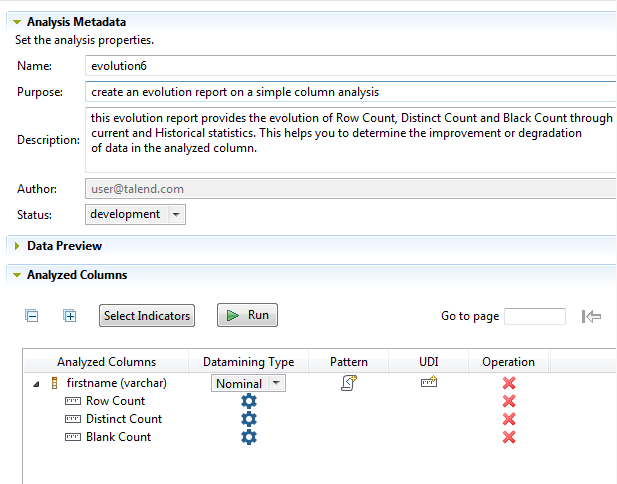
Follow the steps outlined in Creating a basic analysis on a database column to create a simple
column analysis.
In this analysis, you analyze one column using the Row Count, Blank Count and Distinct Count indicators.
-
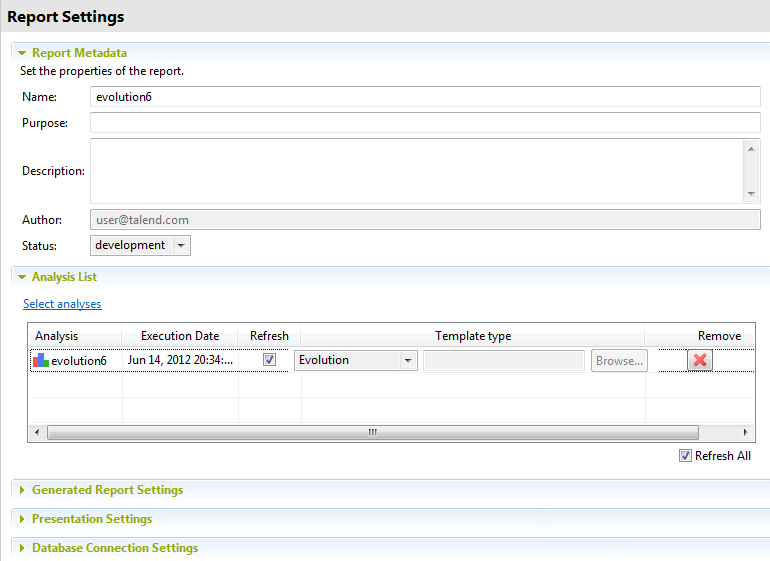
Right-click the analysis name in the DQ
Repository tree view and select New
Report from the contextual menu.
The report editor is displayed with the selected analysis already listed in the Analysis List.
-
From the toolbar of the open report editor, click
 to generate the report file.
The listed analysis is executed, the data is historized in the report database and a report document is generated in the selected format (pdf, html, xsl, or xml). Every time you generate this report, it will compare the current and historical statistics to determine the improvement or degradation of the data in the analyzed column.
to generate the report file.
The listed analysis is executed, the data is historized in the report database and a report document is generated in the selected format (pdf, html, xsl, or xml). Every time you generate this report, it will compare the current and historical statistics to determine the improvement or degradation of the data in the analyzed column.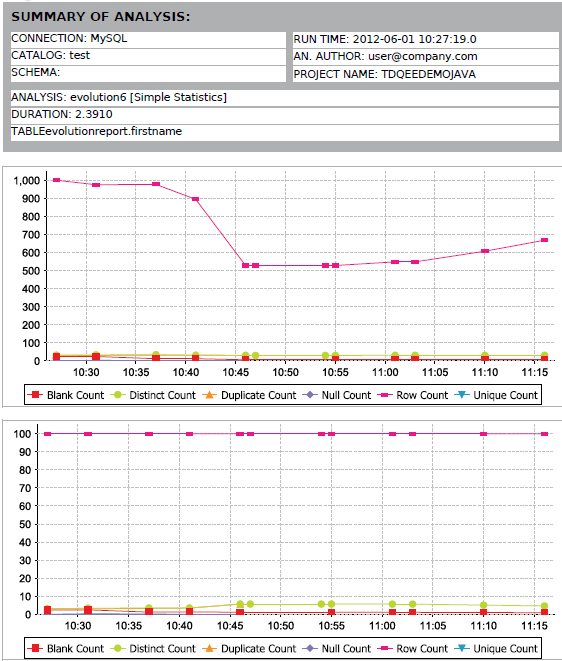
Results
In every evolution report, you will have two graphics: the first indicates the change in the statistics and the second indicates the percentage of that change.
The above report then tracks the evolution through time of the row count, distinct count and blank count of the data records in the column.
Information noteImportant: If you import the items in an evolution report in another project in
Talend Studio, the evolution chart will not display the data of the previous project. For further
information on how to show the evolution of data through all projects, see Migrating evolution reports.
Did this page help you?
If you find any issues with this page or its content – a typo, a missing step, or a technical error – let us know how we can improve!