Skip to main content Skip to complementary content
Close announcements banner

Finalizing and executing the column set analysis on a delimited file

What is left before executing this set of columns analysis is to define the indicator settings, data filter and analysis parameters.

Before you begin

A column set analysis is defined in the Profiling perspective of Talend Studio.

Procedure

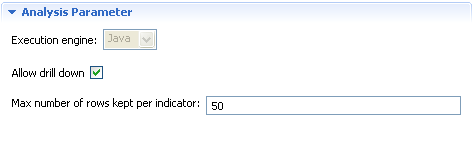
  1. In the Analysis Parameters section, select the Allow drill down check box to store locally the data that will be analyzed by the current analysis.
    Location of the Allow drill down check box in the Analysis Parameters section.
  2. In the Max number of rows kept per indicator field enter the number of the data rows you want to make accessible.
    Information noteNote: The Allow drill down check box is selected by default, and the maximum analyzed data rows to be shown per indicator is set to 50.
  3. Save the analysis and press F6 to execute it.

Results

The editor switches to the Analysis Results view and displays the graphical result corresponding to the Simple Statistics indicators used to analyze the defined set of columns.
Graphical results corresponding to the Simple Statistics indicators in the Simple Statistics section.

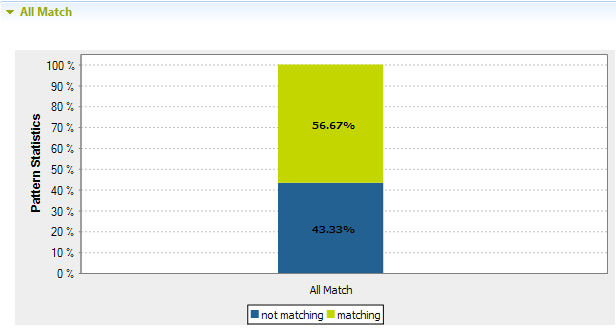
When you use patterns to match the content of the set of columns, another graphic is displayed to illustrate the match and non-match results against the totality of the used patterns.

Graphical results showing the matching and non-matching values against the patterns in the All Match section.

Did this page help you?

If you find any issues with this page or its content – a typo, a missing step, or a technical error – let us know how we can improve!