
Finalizing and executing the functional dependency analysis
Procedure
-
Save the analysis and press F6 to
execute it.
An information pop-up opens to confirm that the operation is in progress and the analysis editor switches to the Analysis Results view.
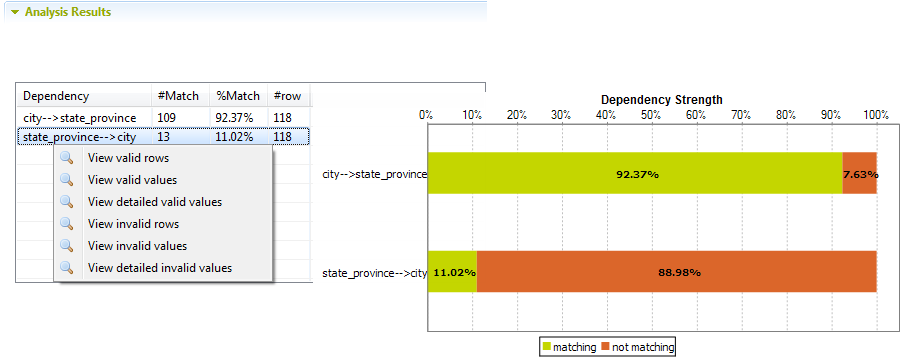 This functional dependency analysis evaluated the records present in the city column and those present in the state_province column against each other to see if the city names match to the listed state names and vice versa. The returned results, in the %Match column, indicate the functional dependency strength for each determinant column. The records that do not match are indicated in red.The #Match column in the result table lists the numbers of the distinct determinant values in each of the analyzed columns. The #row column in the analysis results lists the actual relations between the determinant attribute and the dependant attribute. In this example, #Match in the first row of the result table represents the number of distinct cities, and #row represents the number of distinct pairs (city, state_province). Since these two numbers are not equal, then the functional dependency relationship here is only partial and the ratio of the numbers (%Match) measures the actual dependency strength. When these numbers are equal, you have a "strict" functional dependency relationship, that is to say each city appears only once with each state.Information noteNote: The presence of null values in either of the two analyzed columns will lessen the "dependency strength". The system does not ignore null values, but rather calculates them as values that violates the functional dependency.
Did this page help you?
If you find any issues with this page or its content – a typo, a missing step, or a technical error – let us know how we can improve!