
Talend Trust Score™ overview
The Talend Trust Score™ helps you answer the question "How trustable is my dataset?". This global quality indicator aggregates several metrics into a single and easy to understand score, that scales from 0 to 5. Its evolution in the period chosen is represented with a green flag, if positive, or a red flag, if negative.
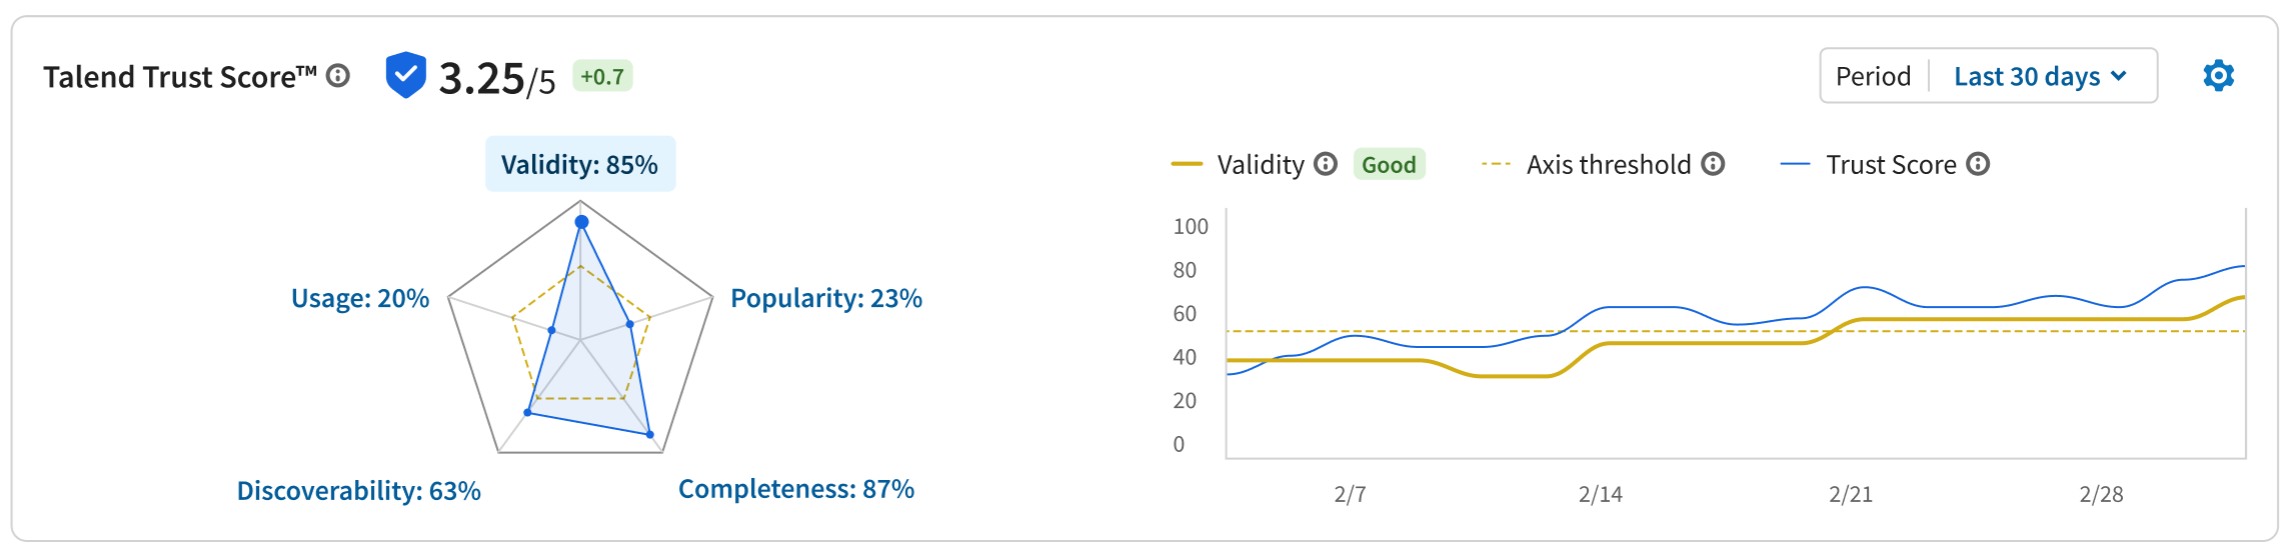
The different factors that can raise or lower the Talend Trust Score™ of a dataset can be regrouped under five main axis:
- Validity, that takes into account the quality of the dataset itself, with the number of valid and invalid values across the dataset sample, as well as the use of semantic types.
- Completeness, that depends on the number of empty records in your sample.
- Popularity, that gives an idea of the reliability of the dataset, via the presence of user ratings and certification level.
- Discoverability, reflecting how well-documented your dataset is, with the use of proper metadata such as a description, tags, custom attributes, as well as the presence of an API. A well documented dataset is easier to find.
- Usage, that shows how much your dataset is used as source for pipelines or preparations.
On the right side of radar chart, you can see a graph composed of three lines:
- The blue line is the Talend Trust Score™ evolving over the chosen period.
- The yellow line is the selected axis score evolving over the chosen period.
- The dotted yellow line is the axis threshold. The threshold represents the minimum
quality requested for the axis score. You can configure the different axis thresholds
by clicking
 above the graph.
Did this page help you?
If you find any issues with this page or its content – a typo, a missing step, or a technical error – let us know how we can improve!