
Data display
You can also fine-tune the chart moment array to be displayed on the horizontal (x) axis of the line chart or multiple line chart to narrow down to the most relevant execution moments.
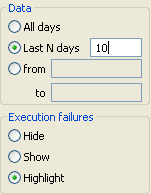
On the Data area, change the radio button selection from All days to the Last N Days or define the array of moments to display in the From... to date settings.
You can smooth the line chart displayed by selecting the Hide check box, in the Execution failures area. All failures are thus excluded from the chart, or you can select the Highlight radio button to highlight the execution failures and spot them more easily.
Did this page help you?
If you find any issues with this page or its content – a typo, a missing step, or a technical error – let us know how we can improve!