
Line chart (standalone Job)
Select a Job instance on the Jobs view to display on the Main Chart view, the line chart corresponding to the various Job execution points plotted on the graph and joined together by a line.
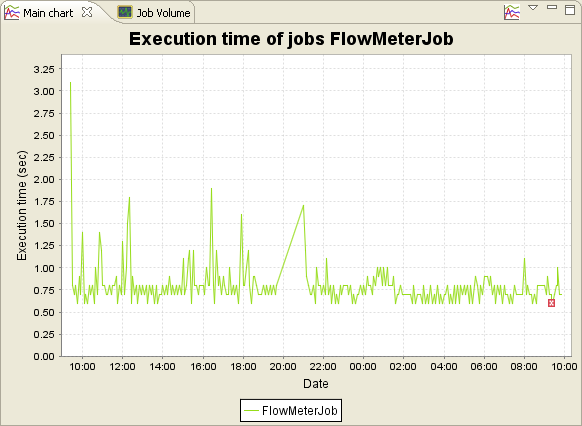
The vertical (y) axis of the chart corresponds to the scale of time (in seconds) needed for the execution of the Job selected.
The horizontal (x) axis of the chart corresponds to the moment (date and time) of each execution.
Did this page help you?
If you find any issues with this page or its content – a typo, a missing step, or a technical error – let us know how we can improve!