
Executing the Job
Procedure
Results
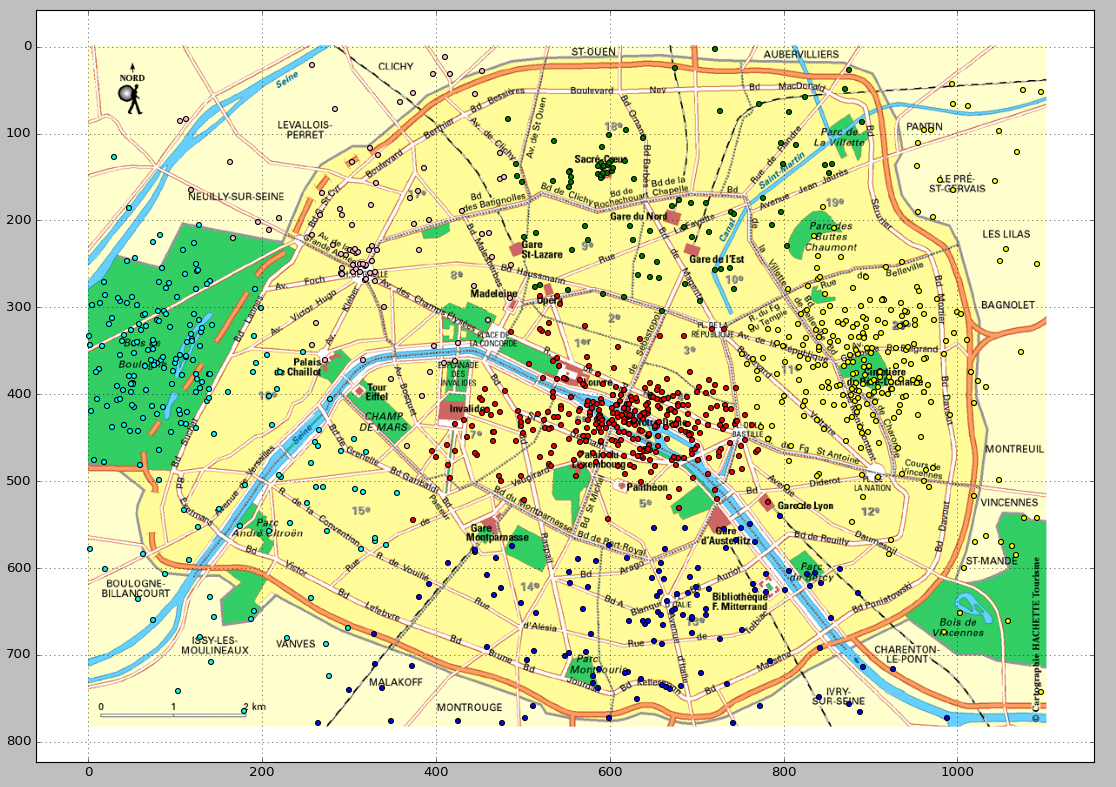
The following image shows an example of the predicted clusters. This visualization is produced via a Python script. You can download this script from here and bear in mind to adapt the path in the script to access the prediction result in your own machine.
Did this page help you?
If you find any issues with this page or its content – a typo, a missing step, or a technical error – let us know how we can improve!