Skip to main content Skip to complementary content

Configuring line chart generation

Procedure

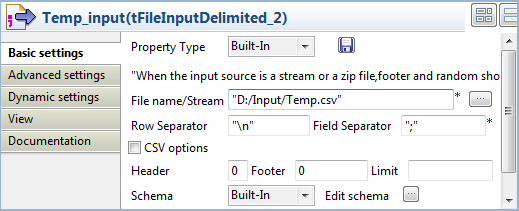
  1. Double-click the second tFileInputDelimited component, which is labeled Temp_Input, to display its Basic settings view.
  2. Fill in the File name field with the path to the temporary input file generated by the tFileOutputDelimited components. In this use case, the temporary input file to the tLineChart is Temp.csv.
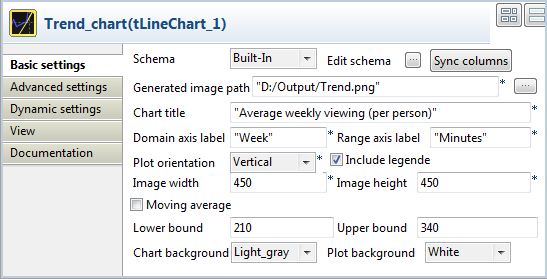
  3. Double-click the tLineChart component to display its Basic settings view.
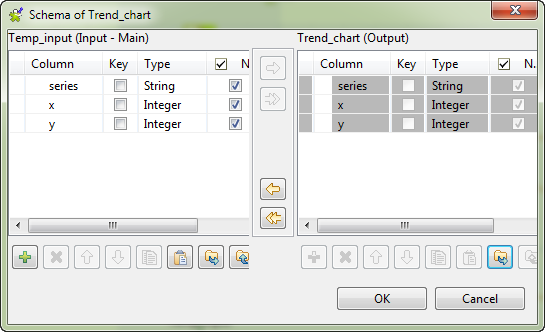
  4. Click Edit schema to open the schema dialog box.
  5. Check that the input and output schemas are synchronized. If needed, copy all the columns from the output schema to the input schema by clicking the left-pointing double arrow button. Then, click OK to close the schema dialog box.
  6. In the Generated image path field, define the path of the image file to be generated.
  7. In the Chart title field, define a title for the line chart. In this use case, enter Average Weekly Viewing (per person) as the chart title.
  8. Define the domain (X) and range (Y) axis labels. In this use case, enter Week and Minutes respectively the axis labels.
  9. Define the image size, the moving average period, the lower and upper bounds, the chart background color, and the background color of the plot area, as you prefer.
    In this use case, we set the image size to 450 by 450, set the lower and upper bounds to 210 and 340 respectively, select light gray as the chart background color, and keep the rest settings are they are.

Did this page help you?

If you find any issues with this page or its content – a typo, a missing step, or a technical error – let us know how we can improve!