Catching flow metrics from a Job
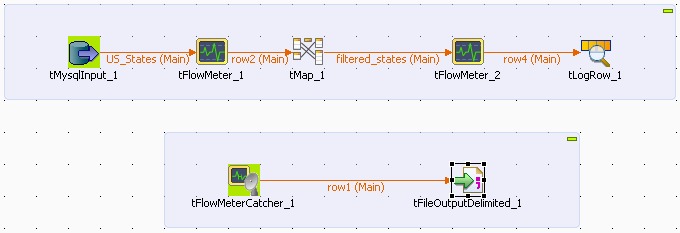
The following basic Job aims at catching the number of rows being passed in the flow processed. The measures are taken twice, once after the input component, that is, before the filtering step and once right after the filtering step, that is, before the output component.
For more technologies supported by Talend, see Talend components.
-
Drop the following components from the Palette to the design workspace: tMysqlInput, tFlowMeter (x2), tMap, tLogRow, tFlowMeterCatcher and tFileOutputDelimited.
-
Link components using row main connections and click on the label to give consistent name throughout the Job, such as US_States from the input component and filtered_states for the output from the tMap component, for example.
-
Link the tFlowMeterCatcher to the tFileOutputDelimited component using a row main link also as data is passed.
-
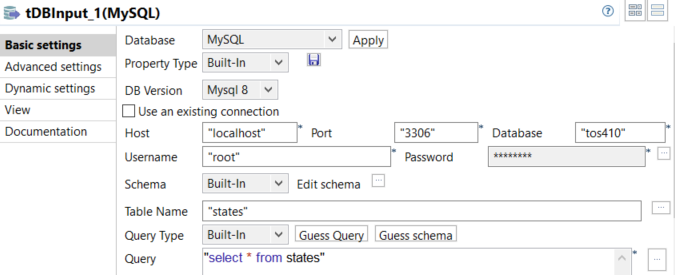
On the tMysqlInput Component view, configure the connection properties as Repository, if the table metadata are stored in the Repository. Or else, set the Type as Built-in and configure manually the connection and schema details if they are built-in for this Job.
-
The 50 States of the USA are recorded in the table states. In order for all 50 entries of the table to get selected, the query to run onto the Mysql database is as follows:
select * from states.
-
Select the relevant encoding type on the Advanced settings vertical tab.
-
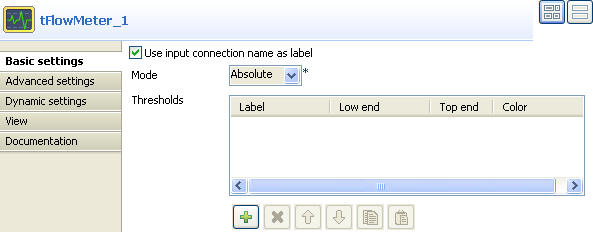
Then select the following component which is a tFlowMeter and set its properties.
-
Select the check box Use input connection name as label, in order to reuse the label you chose in the log output file (tFileOutputDelimited).
-
The mode is Absolute as there is no reference flow to meter against, also no Threshold is to be set for this example.
The Thresholds information is of use within a supervising tool such as Talend Activity Monitoring Console in order to get a proportional representation of the flow process. See this documentation for more information.
-
Then launch the tMap editor to set the filtering properties.
-
For this use case, drag and drop the ID and State columns from the Input area of the tMap towards the Output area. No variable is used in this example.

-
On the Output flow area (labeled filtered_states in this example), click the arrow & plus button to activate the expression filter field.
-
Drag the State column from the Input area (row2) towards the expression filter field and type in the rest of the expression in order to filter the state labels starting with the letter M. The final expression looks like: row2.State.startsWith("M")
-
Click OK to validate the setting.
-
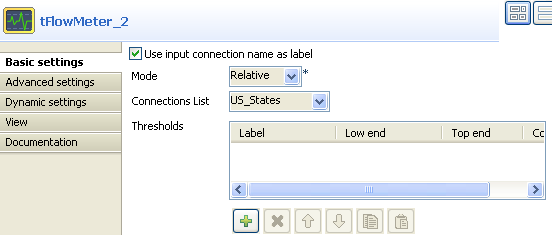
Then select the second tFlowMeter component and set its properties.
-
Select the check box Use input connection name as label.
-
Select Relative as Mode and in the Reference connections list, select US_States as reference to be measured against.
-
Once again, no threshold is used for this use case.
-
No particular setting is required in the tLogRow.
-
Neither does the tFlowMeterCatcher as this component's properties are limited to a preset schema which includes typical log information.
-
So eventually set the log output component (tFileOutputDelimited).

-
Select the Append check box in order to log all tFlowMeter measures.
-
Then save your Job and press F6 to execute it.
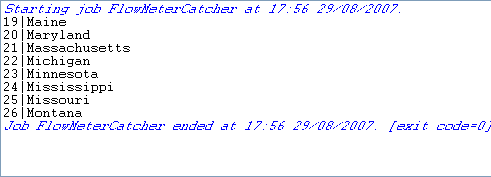
The Run view shows the filtered state labels as defined in the Job.

In the delimited csv file, the number of rows shown in column count varies between tFlowMeter1 and tFlowMeter2 as the filtering has then been carried out. The reference column shows also this difference.
Did this page help you?
If you find any issues with this page or its content – a typo, a missing step, or a technical error – let us know how we can improve!
