
Widget types and calculations
Trend and numerical widgets are used to provide you with at-a-glance information about your data.
Trend widgets
Trend widgets show the evolution of quantitative values over time.
-
Trends in number of tasks resolved: Shows the overall
evolution of the number of the tasks resolved.
This widget helps to track the number of tasks resolved in time. When filtered by data stewards, it can help identify if the workload is well balanced among data stewards.
Calculation: This widget takes into account only the current state of tasks, that is a task counts only once even if it was reopened and resolved several times. For the time axis, the resolution date is used which is Day by default, but can be Week, Month, Quarter, or Year.
-
Trends in number of tasks not resolved before due date: Shows the overall evolution of the number of tasks not resolved within the defined SLA.
If tasks are not resolved in time, you should find out why that is. This widget can help pinpoint weaknesses. When filtered by data stewards, it can help identify what stewards take longer to resolve tasks. What are they struggling with? May be the workload is not well balanced among them. You may need to apply actions to improve processes and make sure SLAs are being met.
Comparing the results of this widget with the trends in number of resolved tasks can help to see if we don’t respect SLA because there is no balance on number of tasks among data stewards.
Calculation: This widget takes into account the current state of the tasks, that is a task counts only once even if it was reopened and resolved several times. For the time axis, the due date is used. This widget takes into account two types of tasks:- Tasks resolved but SLA is not met as the resolution date has passed the due date.
- Tasks not yet resolved and SLA due date has already been expired.
If you do not select a start date or end date for the widget, the campaign creation date and the current day date are set by default.
-
Trends in average task resolution time: Shows the overall evolution of the resolution time of the resolved tasks, that is the evolution of the delay between task creation date and the date of its transition to the terminal state of the campaign workflow.
This widget helps to see the average time it took stewards to resolve tasks. It reflects your team’s efficiency and how effective processes are. Keeping an eye on this widget allows you to notice trends and quickly see if resolution time is increasing or decreasing and apply actions to improve a specific area.
Calculation: This widget takes into account the current state of tasks, that is a task counts only once even if it was reopened and resolved several times. For the time axis, the date of the last resolution is used. The resolution time is given in milliseconds, but is displayed in the most pertinent time unit in the chart.
For all trend widgets, no filter is set on stewards when you access the widget for the first time and a single line is displayed which includes data on all stewards of the campaign. If you selects some stewards in the steward filter, the graph is refreshed to display one line per steward where every line has a different color. If you clear the check boxes of all stewards, the single line is displayed.
The total number of lines to be displayed by a chart is five. When you select more than five stewards, stewards with the lowest task count are grouped in the fifth line.
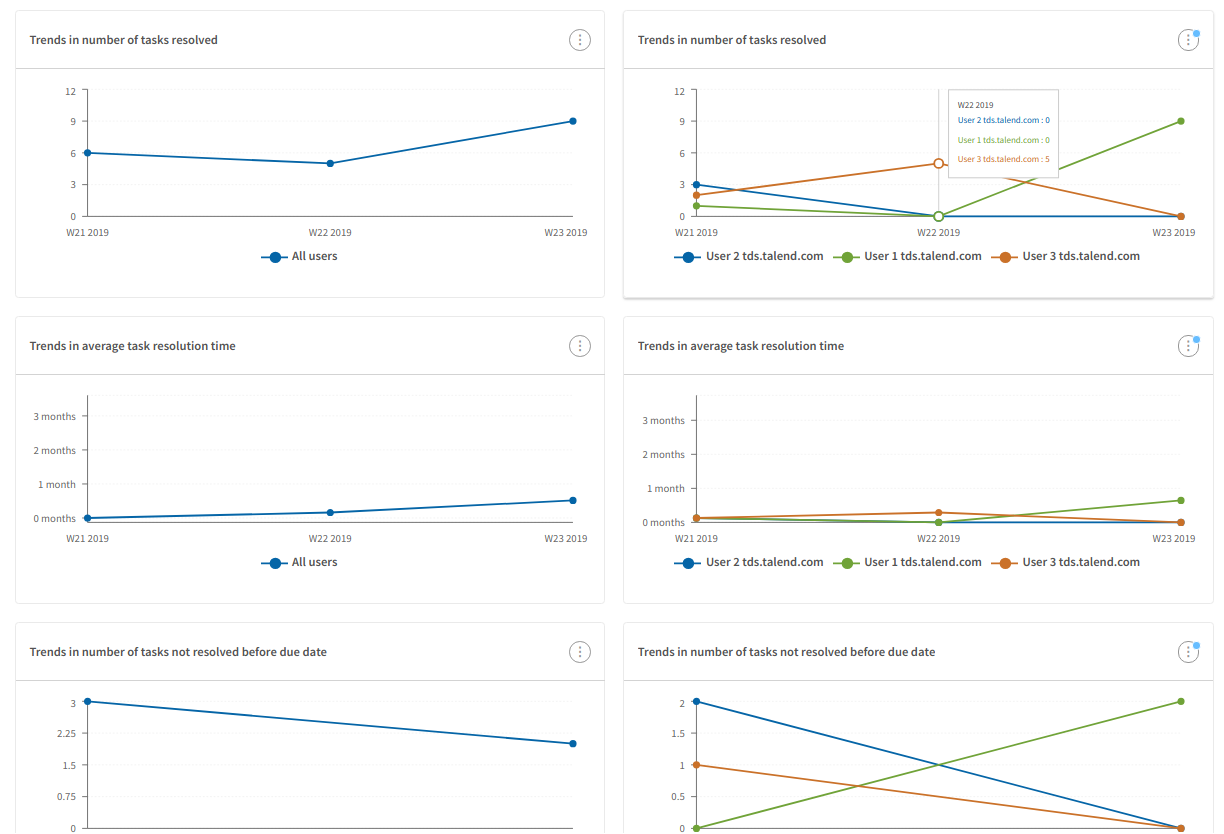
Clicking a line in the chart or the steward's username in the chart legend highlights the line.
When you hover over a line or a data point in the chart, information about the data is displayed in a tooltip.
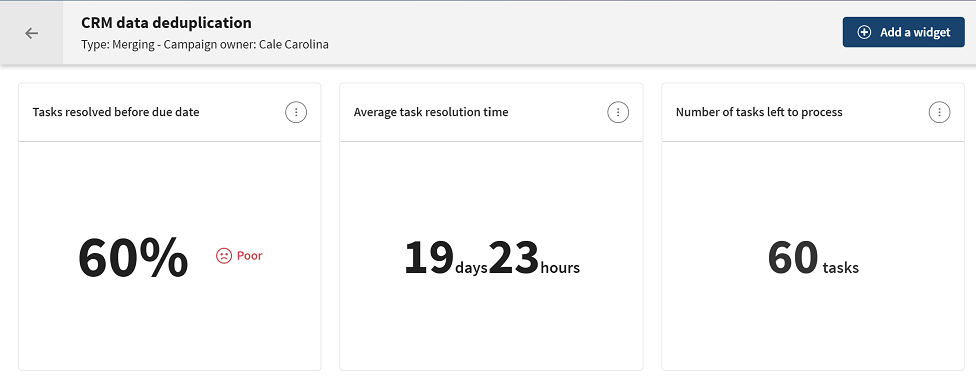
Numerical widgets
Numerical widgets show a numeric value which can be a percentage or a value with a time unit.
-
Tasks resolved before due
date: Shows the percentage of tasks which are resolved within
the defined SLA.
This widget measures the rate at which your team is resolving tasks in time. When filtered by data stewards, it can help identify if the workload is well balanced among data stewards.
Calculation: This widget takes into account the current state of tasks. The percentage is computed as the following: <count of tasks matching SLA> / <count of tasks>.
The <count of tasks matching SLA> includes the following tasks:- Tasks resolved within SLA.
- Tasks resolved without due date.
The <count of tasks> includes the following tasks:- Tasks which are resolved.
- Tasks not resolved and with an expired due date.
If the widget does not find any tasks out of SLA for the provided filters, 100 % is displayed.
Data in the chart is represented by the following color assignments:- Less than 80%: red
- Between 80% and 90%: orange
- More than 90%: green
-
Average task resolution
time: Shows the average resolution time of the tasks which were
resolved.
This widget helps to see the time it took stewards to resolve tasks. It measures your team’s efficiency and shows how well it is performing against the set standards. When filtered by data stewards, it can help to ensure consistency among your team members.
Calculation: This widget takes into account the current state of tasks. The resolution time is given in milliseconds, but is displayed in the most pertinent time unit in the chart. The percentage is computed as the following: Sum of all (resolution date - creation date) of resolved tasks / count of resolved tasks.
It displays the average time with two time units as the following: month/day, day/hour, hour/minute. Values are rounded up.
-
Number of remaining tasks left to
process: Shows the number of remaining tasks over the campaign,
for all stewards, or specific data stewards when filtering by data stewards.
Calculation: This widget takes into account all the tasks that are not resolved over the campaign.
Did this page help you?
If you find any issues with this page or its content – a typo, a missing step, or a technical error – let us know how we can improve!