
Metrics in Talend Cloud Pipeline Designer
In Talend Cloud Pipeline Designer, live metrics are available and allow you to access information about the number of records, volumes, execution time, limitations, etc.
What are they about and how are they displayed?
These metrics provide the following information:
-
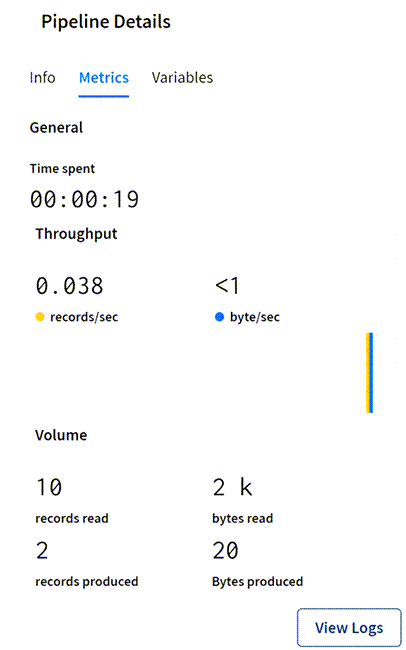
General: Pipeline execution time (in hours, minutes, and seconds).
-
Throughput: Performance including number of records processed per second and corresponding volume of data.
- Volume: Total number of read records, produced records and corresponding volume of data.
How can I access them?
To access the metrics related to your pipelines, you need to go to the Metrics tab of the Pipeline Details panel.Did this page help you?
If you find any issues with this page or its content – a typo, a missing step, or a technical error – let us know how we can improve!